In this article, you will learn how to evaluate k-means clustering results using silhouette analysis and interpret both average and per-cluster scores to guide model choices.
Topics we will cover include:
- What the silhouette score measures and how to compute it
- How to use silhouette analysis to pick a reasonable number of clusters
- Visualizing per-sample silhouettes to diagnose cluster quality
Here’s how it works.

K-Means Cluster Evaluation with Silhouette Analysis
Image by Editor
Introduction
Clustering models in machine learning must be assessed by how well they separate data into meaningful groups with distinctive characteristics. One of the key metrics for evaluating the internal cohesion and mutual separation of clusters produced by iterative algorithms like k-means is the silhouette score, which quantifies how similar an object — a data instance i — is to its own cluster compared to other clusters.
This article focuses on how to evaluate and interpret cluster quality through silhouette analysis, that is, an analysis of cluster structure and validity based on disciplined use of the silhouette metric. Silhouette analysis has practical implications in real-world segmentation tasks across marketing, pharmaceuticals, chemical engineering, and more.
Understanding the Silhouette Metric
Given a data point or instance i in a dataset that has been partitioned into k clusters, its silhouette score is defined as:
\[ s(i) = \frac{b(i) – a(i)}{\max\{a(i), b(i)\}} \]
In the formula, a(i) is the intra-cluster cohesion, that is, the average distance between i and the rest of the points in the cluster it belongs to. Meanwhile, b(i) is the inter-cluster separation, namely, the average distance between i and the points in the closest neighboring cluster.
The silhouette score ranges from −1 to 1. Lower a(i) and higher b(i) values contribute to a higher silhouette score, which is interpreted as higher-quality clustering, with points strongly tied to their cluster and well separated from other clusters. In sum, the higher the silhouette score, the better.
In practice, we typically compute the average silhouette score across all instances to summarize cluster quality for a given solution.
The silhouette score is widely used to evaluate cluster quality in diverse datasets and domains because it captures both cohesion and separation. It is also useful, as an alternative or a supplement to the Elbow Method, for selecting an appropriate number of clusters k — a necessary step when applying iterative methods like k-means and its variants.
Additionally, the silhouette score doubles as an insightful visual aid when you plot individual and cluster-level silhouettes, with bar widths reflecting cluster sizes. The following example shows silhouettes for every instance in a dataset partitioned into three clusters, grouping silhouettes by cluster to facilitate comparison with the overall average silhouette for that clustering solution.
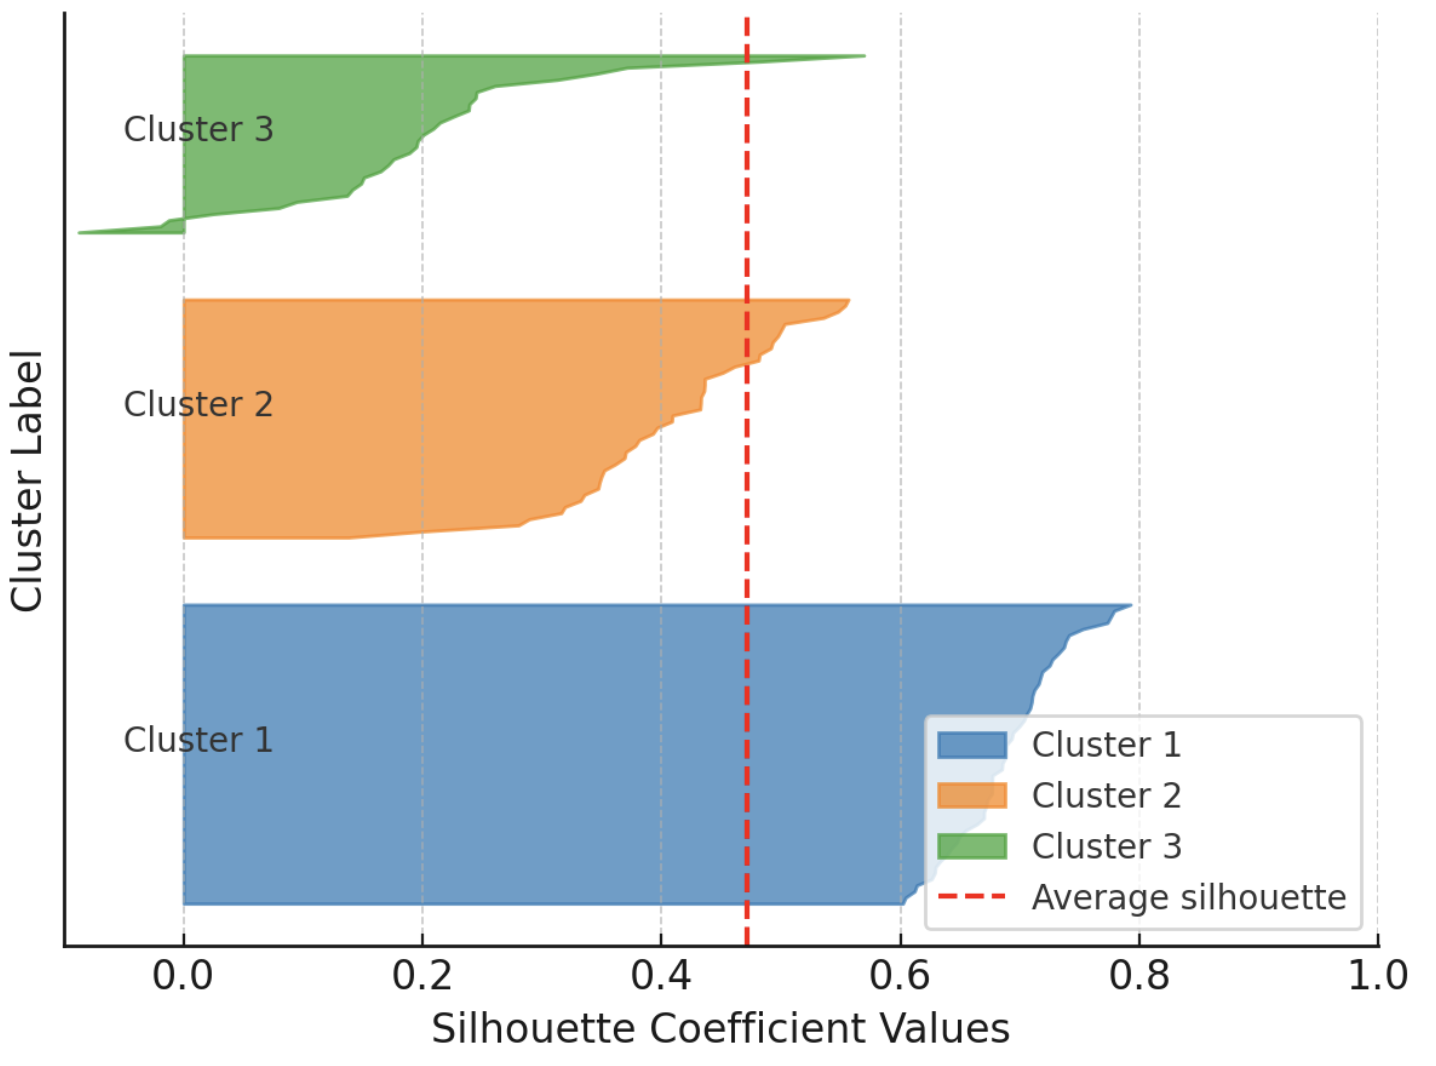
Example visualization of silhouette scores
Image by Author
On the downside, silhouette analysis may be less reliable for certain datasets and cluster shapes (e.g., non-convex or intricately shaped clusters) and can be challenging in very high-dimensional spaces.
Silhouette Analysis in Action: The Penguins Dataset
To illustrate cluster evaluation using silhouette analysis, we will use the well-known Palmer Archipelago penguins dataset, specifically the version freely available here.
We quickly walk through the preparatory steps (loading and preprocessing), which are explained in detail in this introductory cluster analysis tutorial. We will use pandas, scikit-learn, Matplotlib, and NumPy.
|
1 2 3 4 5 6 7 8 9 10 11 12 13 14 15 16 17 |
import pandas as pd from sklearn.preprocessing import StandardScaler from sklearn.cluster import KMeans from sklearn.metrics import silhouette_score, silhouette_samples import matplotlib.pyplot as plt import numpy as np
# Load dataset (replace with actual path or URL) penguins = pd.read_csv(‘https://raw.githubusercontent.com/gakudo-ai/open-datasets/refs/heads/main/penguins.csv’) penguins = penguins.dropna()
features = [‘bill_length_mm’, ‘bill_depth_mm’, ‘flipper_length_mm’, ‘body_mass_g’] X = penguins[features]
# Scale numerical features for more effective clustering scaler = StandardScaler() X_scaled = scaler.fit_transform(X) |
Next, we apply k-means to find clusters in the dataset. We repeat this process for multiple values of the number of clusters k (the n_clusters parameter), ranging from 2 to 6. For each setting, we calculate the silhouette score.
|
range_n_clusters = list(range(2, 7)) silhouette_avgs = []
for n_clusters in range_n_clusters: kmeans = KMeans(n_clusters=n_clusters, n_init=10, random_state=42) cluster_labels = kmeans.fit_predict(X_scaled) sil_avg = silhouette_score(X_scaled, cluster_labels) silhouette_avgs.append(sil_avg) print(f“For n_clusters = {n_clusters}, average silhouette_score = {sil_avg:.3f}”) |
The resulting output is:
|
For n_clusters = 2, average silhouette_score = 0.531 For n_clusters = 3, average silhouette_score = 0.446 For n_clusters = 4, average silhouette_score = 0.419 For n_clusters = 5, average silhouette_score = 0.405 For n_clusters = 6, average silhouette_score = 0.392 |
This suggests that the highest silhouette score is obtained for k = 2. This usually indicates the most coherent grouping of the data points, although it does not always match biological or domain ground truth.
In the penguins dataset, although there are three species with distinct traits, repeated k-means clustering and silhouette analysis indicate that partitioning the data into two groups can be more consistent in the chosen feature space. This can happen because silhouette analysis reflects geometric separability in the selected features (here, four numeric attributes) rather than categorical labels; overlapping traits among species may lead k-means to favor fewer clusters than the actual number of species.
Let’s visualize the silhouette results for all five configurations:
|
1 2 3 4 5 6 7 8 9 10 11 12 13 14 15 16 17 18 19 20 21 22 23 24 25 26 27 28 29 30 31 32 33 |
fig, axes = plt.subplots(1, len(range_n_clusters), figsize=(25, 5), sharey=False)
for i, n_clusters in enumerate(range_n_clusters): ax = axes[i]
kmeans = KMeans(n_clusters=n_clusters, n_init=10, random_state=42) labels = kmeans.fit_predict(X_scaled) sil_vals = silhouette_samples(X_scaled, labels) sil_avg = silhouette_score(X_scaled, labels)
y_lower = 10 for j in range(n_clusters): ith_sil_vals = sil_vals[labels == j] ith_sil_vals.sort() size_j = ith_sil_vals.shape[0] y_upper = y_lower + size_j color = plt.cm.nipy_spectral(float(j) / n_clusters) ax.fill_betweenx(np.arange(y_lower, y_upper), 0, ith_sil_vals, facecolor=color, edgecolor=color, alpha=0.7) ax.text(–0.05, y_lower + 0.5 * size_j, str(j)) y_lower = y_upper + 10 # separation between clusters
ax.set_title(f“Silhouette Plot for k = {n_clusters}”) ax.axvline(x=sil_avg, color=“red”, linestyle=“–“) ax.set_xlabel(“Silhouette Coefficient”) if i == 0: ax.set_ylabel(“Cluster Label”) ax.set_xlim([–0.1, 1]) ax.set_ylim([0, len(X_scaled) + (n_clusters + 1) * 10])
plt.tight_layout() plt.show() |
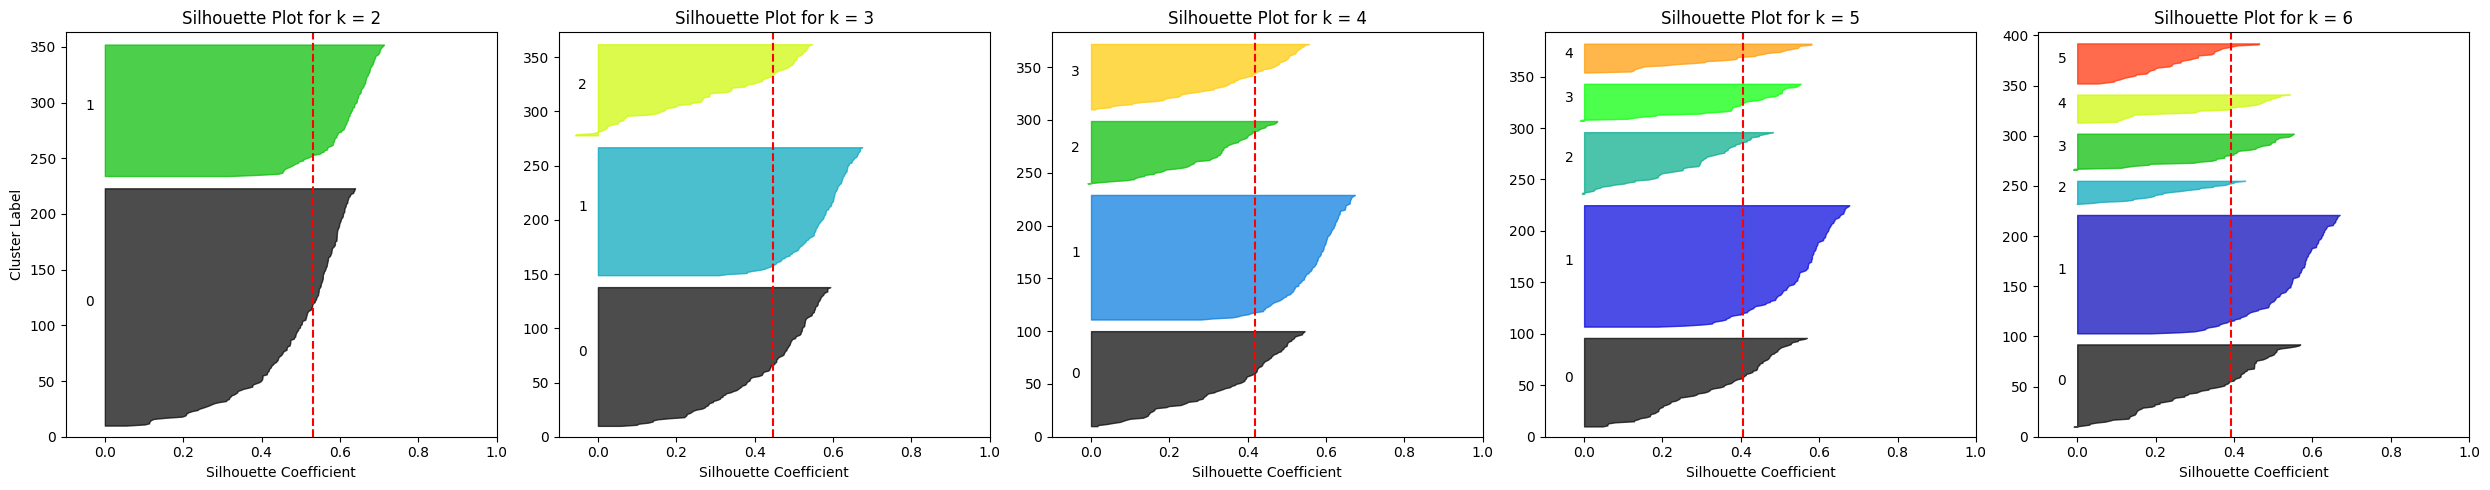
Silhouette plots for multiple k-means configurations on the Penguins dataset
Image by Author
One clear observation is that for k ≥ 4 the average silhouette score drops to roughly 0.4, while it is higher for k = 2 or k = 3.
What if we consider a different (narrower) subset of attributes for clustering? For instance, consider only bill length and flipper length. This is as simple as replacing the feature selection statement near the start of the code with:
|
features = [‘bill_length_mm’, ‘flipper_length_mm’] |
Then rerun the rest. Try different feature selections prior to clustering and check whether the silhouette analysis results remain similar or vary for some choices of the number of clusters.
Wrapping Up
This article provided a concise, practical understanding of a standard cluster-quality metric for clustering algorithms: the silhouette score, and showed how to use it to analyze clustering results critically.
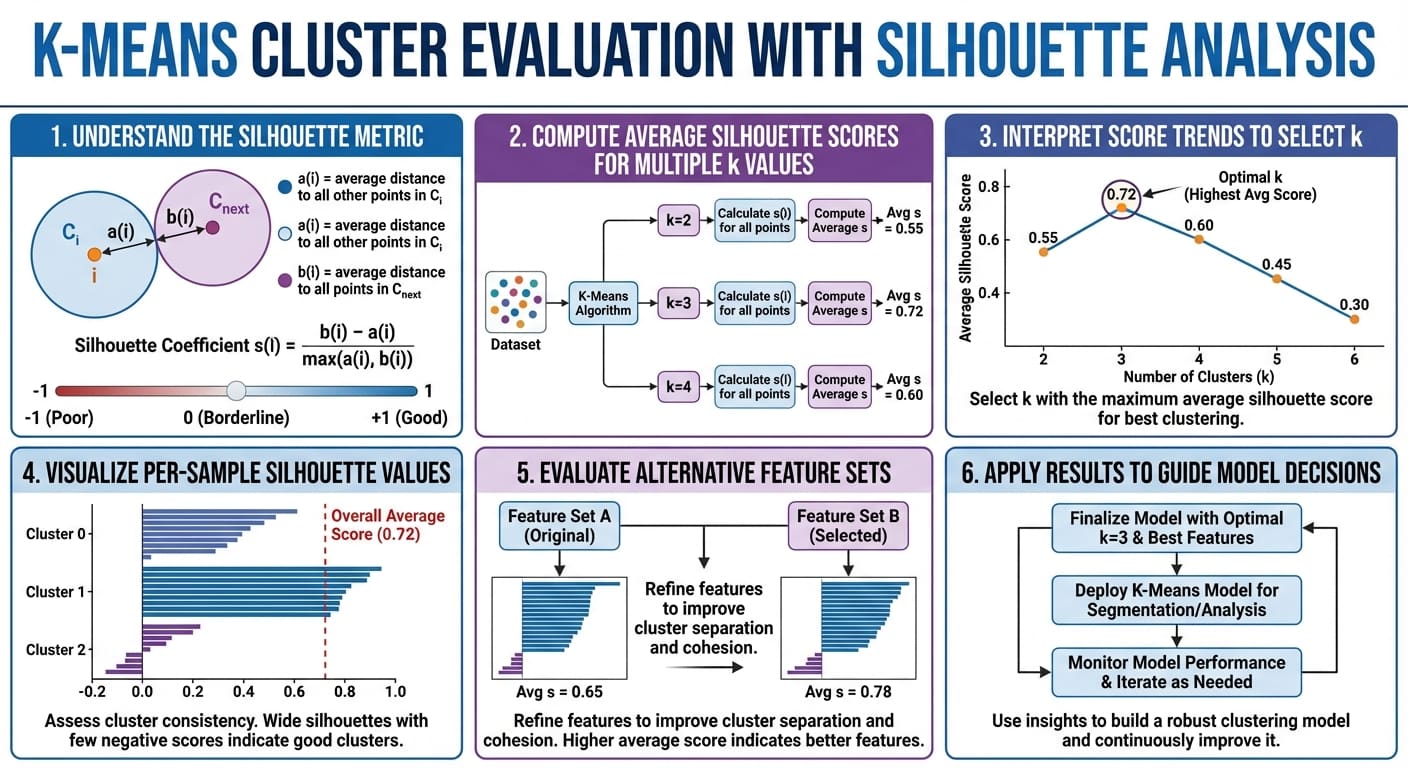
K-means cluster evaluation with silhouette analysis in six easy steps (click to enlarge)