

TLDR
What happens when one machine dies in the middle of a multi-node training run?
If you’ve trained large models across many machines, you already know the answer: the communication times out, every worker exits, and you re-launch the whole job from the last checkpoint. It’s painful, and it’s just how distributed training works. Or is it?
In this article we’ll explore a possible answer, called elastic training, using the JAX AI stack (MaxText and Pathway) and on Cloud TPUs. We’ll train a LLM across multiple TPU chips on Google Kubernetes Engine (GKE), cause a worker to fail on purpose, and watch the training process recover in place without restarting. All this using the same process, same PID, no re-launch. In our run, total downtime from kill to the next training step was about less than two minutes , and most of that was waiting for Kubernetes to schedule a replacement pod.
By the end, you’ll understand exactly which three components make that possible, where the approach still has rough edges, and how to reproduce everything yourself.
Let’s start with the problem.
Why distributed training is so fragile
Imagine you’re training a model across multiple machines (or nodes). Your model weights are sharded, so each machine holds a piece. Every training step, the machines compute gradients on their piece and then an all-reduce operation runs where everyone exchanges gradients so the model stays in sync.
Here’s the catch: an all-reduce needs every participant. If one machine disappears, the other ones sit there waiting for data that will never arrive. Eventually a timeout fires, the collective fails, and every process exits. As a result, one machine takes down the whole job.
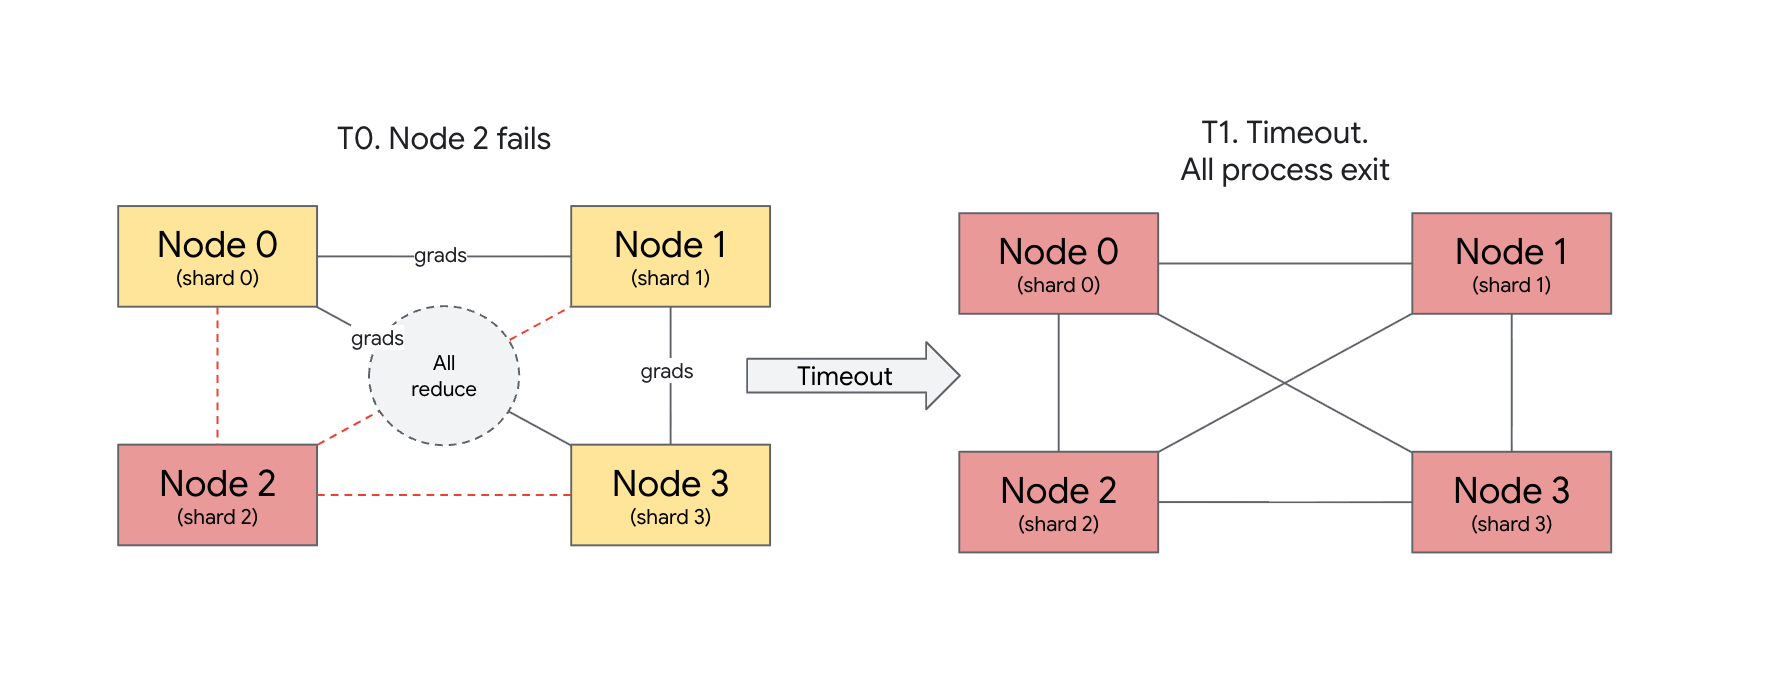
The standard fix is usually outside your training code. A scheduler (Slurm, Kubernetes, Ray, take your pick) notices the job died, reallocates it and re-launches everything from scratch. You pay the full restart cost: scheduling fresh pods, starting fresh containers and Python processes, reconnecting to the accelerators, and warming up the dataloader. And you lose every step since the last checkpoint.
But what if the training process could just catch the failure and keep going? That’s what we’re going to look at now.
MaxText, Pathways, and Orbax on TPU
If you’re new to the TPU ecosystem, it has its own vocabulary. Let’s introduce the pieces we’ll use and how they fit together.
Our hardware unit is the TPU chip, an accelerator built around matrix-multiply units. Chips are grouped into a TPU slice, a set of chips wired together with a fast dedicated interconnect called ICI (Inter-Chip Interconnect). Within a slice, chips are attached to ordinary CPU host VMs (four hosts per slice in our setup), and those hosts are what actually run the worker processes.
To program those chips we use JAX, a NumPy-flavored array and autograd framework that uses XLA as its compiler. If you’re coming from PyTorch, it fills the same role. We won’t write a training loop from scratch, though. We’ll use MaxText, an open-source LLM training library written in pure Python and JAX. You hand it a model name and a config, and it gives you a fully sharded training loop.
Two more pieces complete the picture. Pathways is the orchestration layer that connects our Python script to all chips, and it’s the key to this whole story for a reason we’ll get to in a moment. And Orbax handles checkpointing: it coordinates the save from the controller, while each TPU host writes its own shard of the model state directly to Cloud Storage in parallel. That gives us something to fall back to when things go wrong.
Here’s how it looks all together:
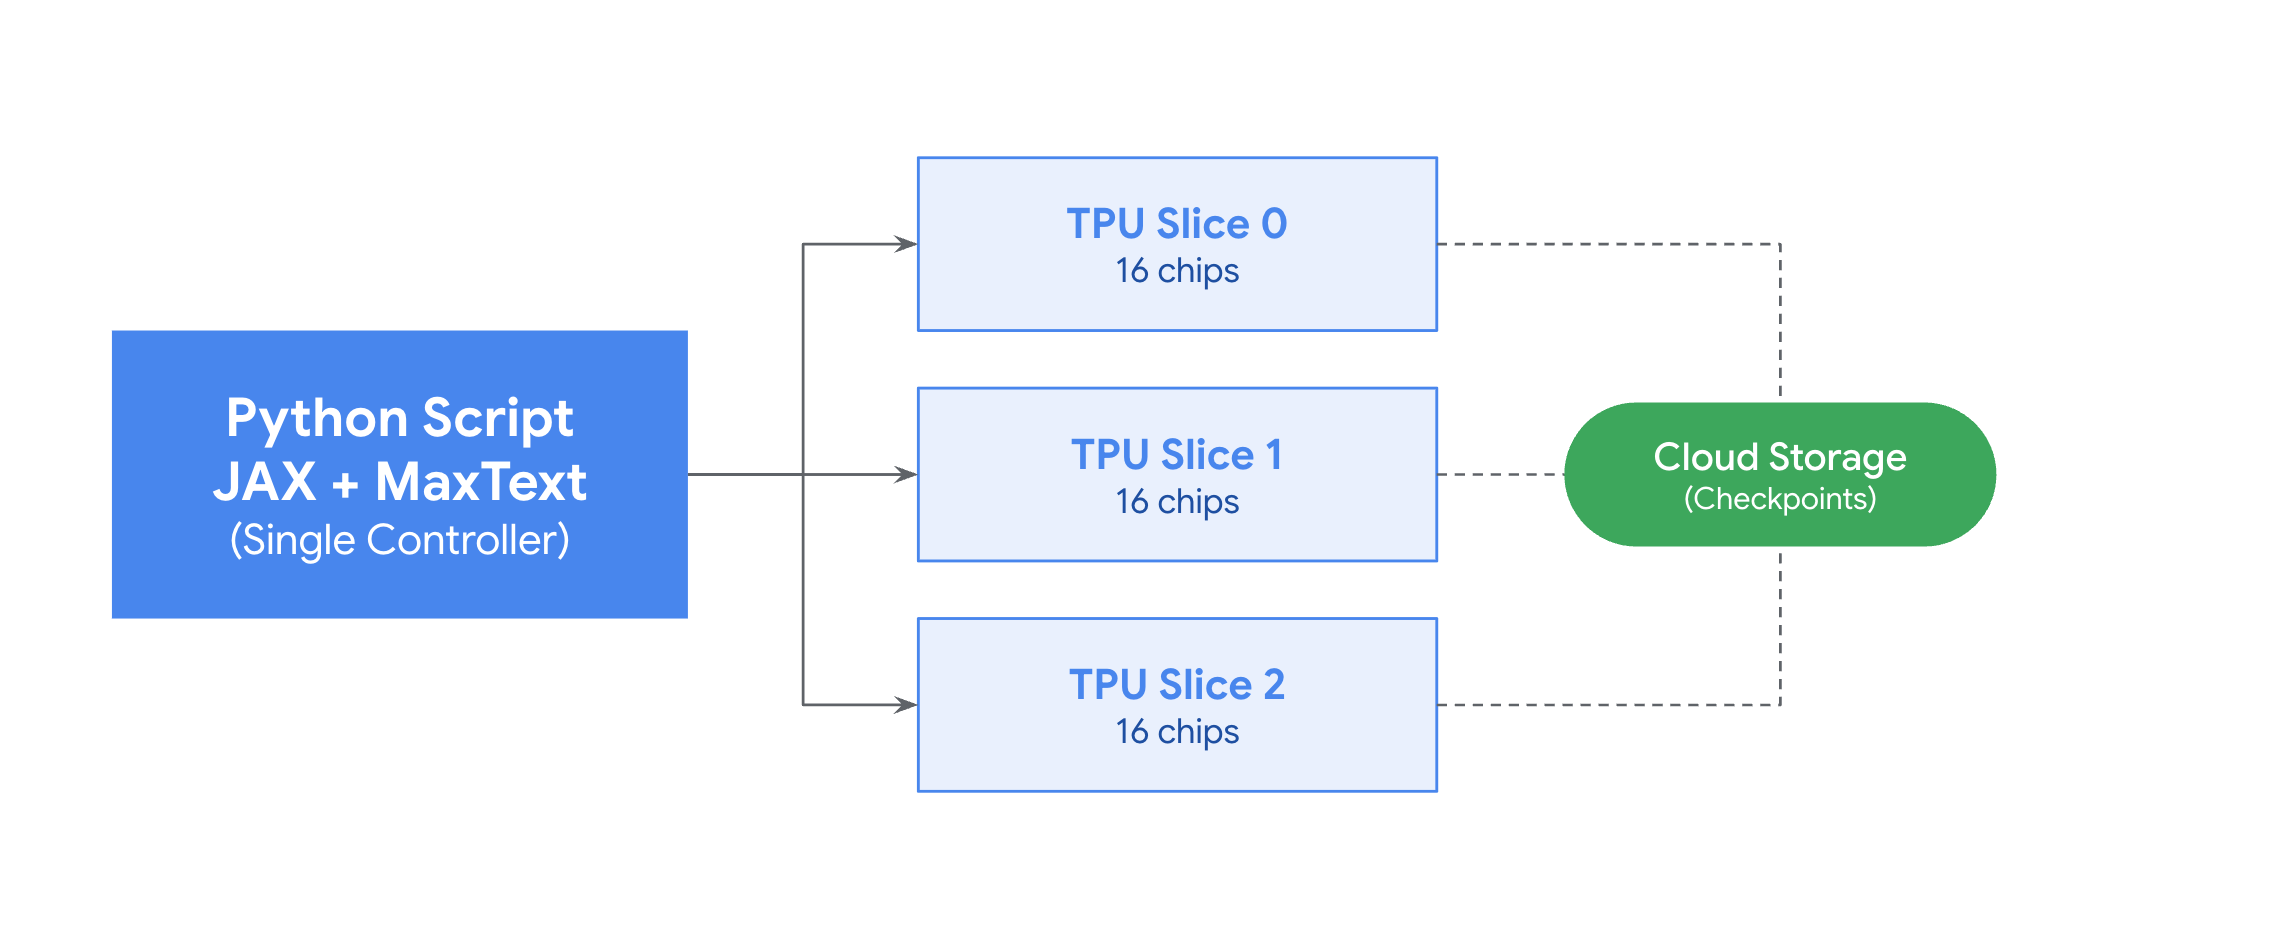
The component to remember here is the single controller.
In most distributed-training launchers, you start one Python process per node. Each one runs an identical copy of your script, and they coordinate as equals (this is called SPMD, or Single Program Multiple Data). With Pathways, there is exactly one Python process, running on a plain CPU machine, and it sees every TPU chip in the cluster as if they were local. Call jax.devices() and you get all chips back. The TPU machines themselves just run a thin worker binary that receives compiled programs and executes them.
Why does this matter for failure handling? Because when a TPU machine dies, there is still a healthy Python process alive on the CPU node that can do something about it.
Let’s see what “doing something about it” looks like.
What “elastic training” means here
Let’s be clear about what we’re building, because “elastic” gets used for a lot of things.
At its core, elastic training here means that when hardware fails, your training loop receives a Python exception instead of a process termination. And because you’re still inside a live process, with your config and imports already loaded and the surviving TPU slices still up and awaiting instructions, you have options.
Two simple, yet powerful, examples are pause and resume and replica resize.
In pause and resume, the exception gets caught, you wait for the failed slice to be replaced, then reload the last viable checkpoint and continue on the full mesh. In replica resize, you reload the last viable checkpoint immediately onto the surviving slices and training keeps running at reduced throughput while the replacement comes up, then scales back to full size once it’s ready.
Both are available in MaxText today. This post walks through pause and resume, the simpler of the two. You could write that exception handler yourself, but you don’t have to. The pathwaysutils library provides a decorator called elastic_retry that wraps an entire training function, and MaxText already wires it in for you. When the failure exception fires, the decorator catches it, cleans up any partial state, restores the last viable checkpoint, and calls the training function again. All inside the same process.
It’s worth being precise about why this is faster than a restart, because elastic recovery doesn’t skip as much as you might think. Calling the training function again from the beginning means model setup, the dataloader, and the checkpoint restore all run a second time but you’d pay every one of those on a full job restart too. Pod scheduling isn’t free here either: the failed worker still needs a replacement pod scheduled onto the impacted slice, and that wait dominates the wall clock. What elastic recovery actually saves you is everything around that one slice. A full restart tears down and reschedules the whole workload, from the controller (head) pod, every healthy worker pod, to the fresh controller Python process that comes with them, while elastic recovery leaves all of it running and only swaps the slice that died.
Compilation, notably, is not part of that saving. Pathways keeps a persistent compilation cache in Cloud Storage (on by default), so a full restart reloads the compiled XLA executables from the cache instead of recompiling cold, and elastic recovery pays a comparable cost when it re-enters the training function on the rebuilt mesh. The difference between the two paths is the teardown, not the compile — and in our run, skipping that full-workload teardown was the difference between about hundreds of seconds and several minutes. Replica resize then adds something a restart can’t offer at all: training keeps going even if some of the TPUs never come back.
Before we go on, a quick word on a name that’s easy to confuse with what we’ve just described. Suspend-resume and the elastic pause and resume sound alike but solve different problems. If you’re running on Spot TPUs, planned preemptions take their own path: Pathways’ suspend-resume feature listens for the preemption notice, saves accelerator state to Cloud Storage automatically, and resumes when the pod is rescheduled — no user code needed. That’s for interruptions that arrive with a warning. Elastic training, the mechanism we’re walking through here, is the path for the unplanned failures where there’s no notice at all.
Now let’s look at the three pieces that actually have to cooperate to make this work.
How elastic recovery works
For elastic recovery, three independent components have to cooperate. Here’s how they’re laid out on the cluster.
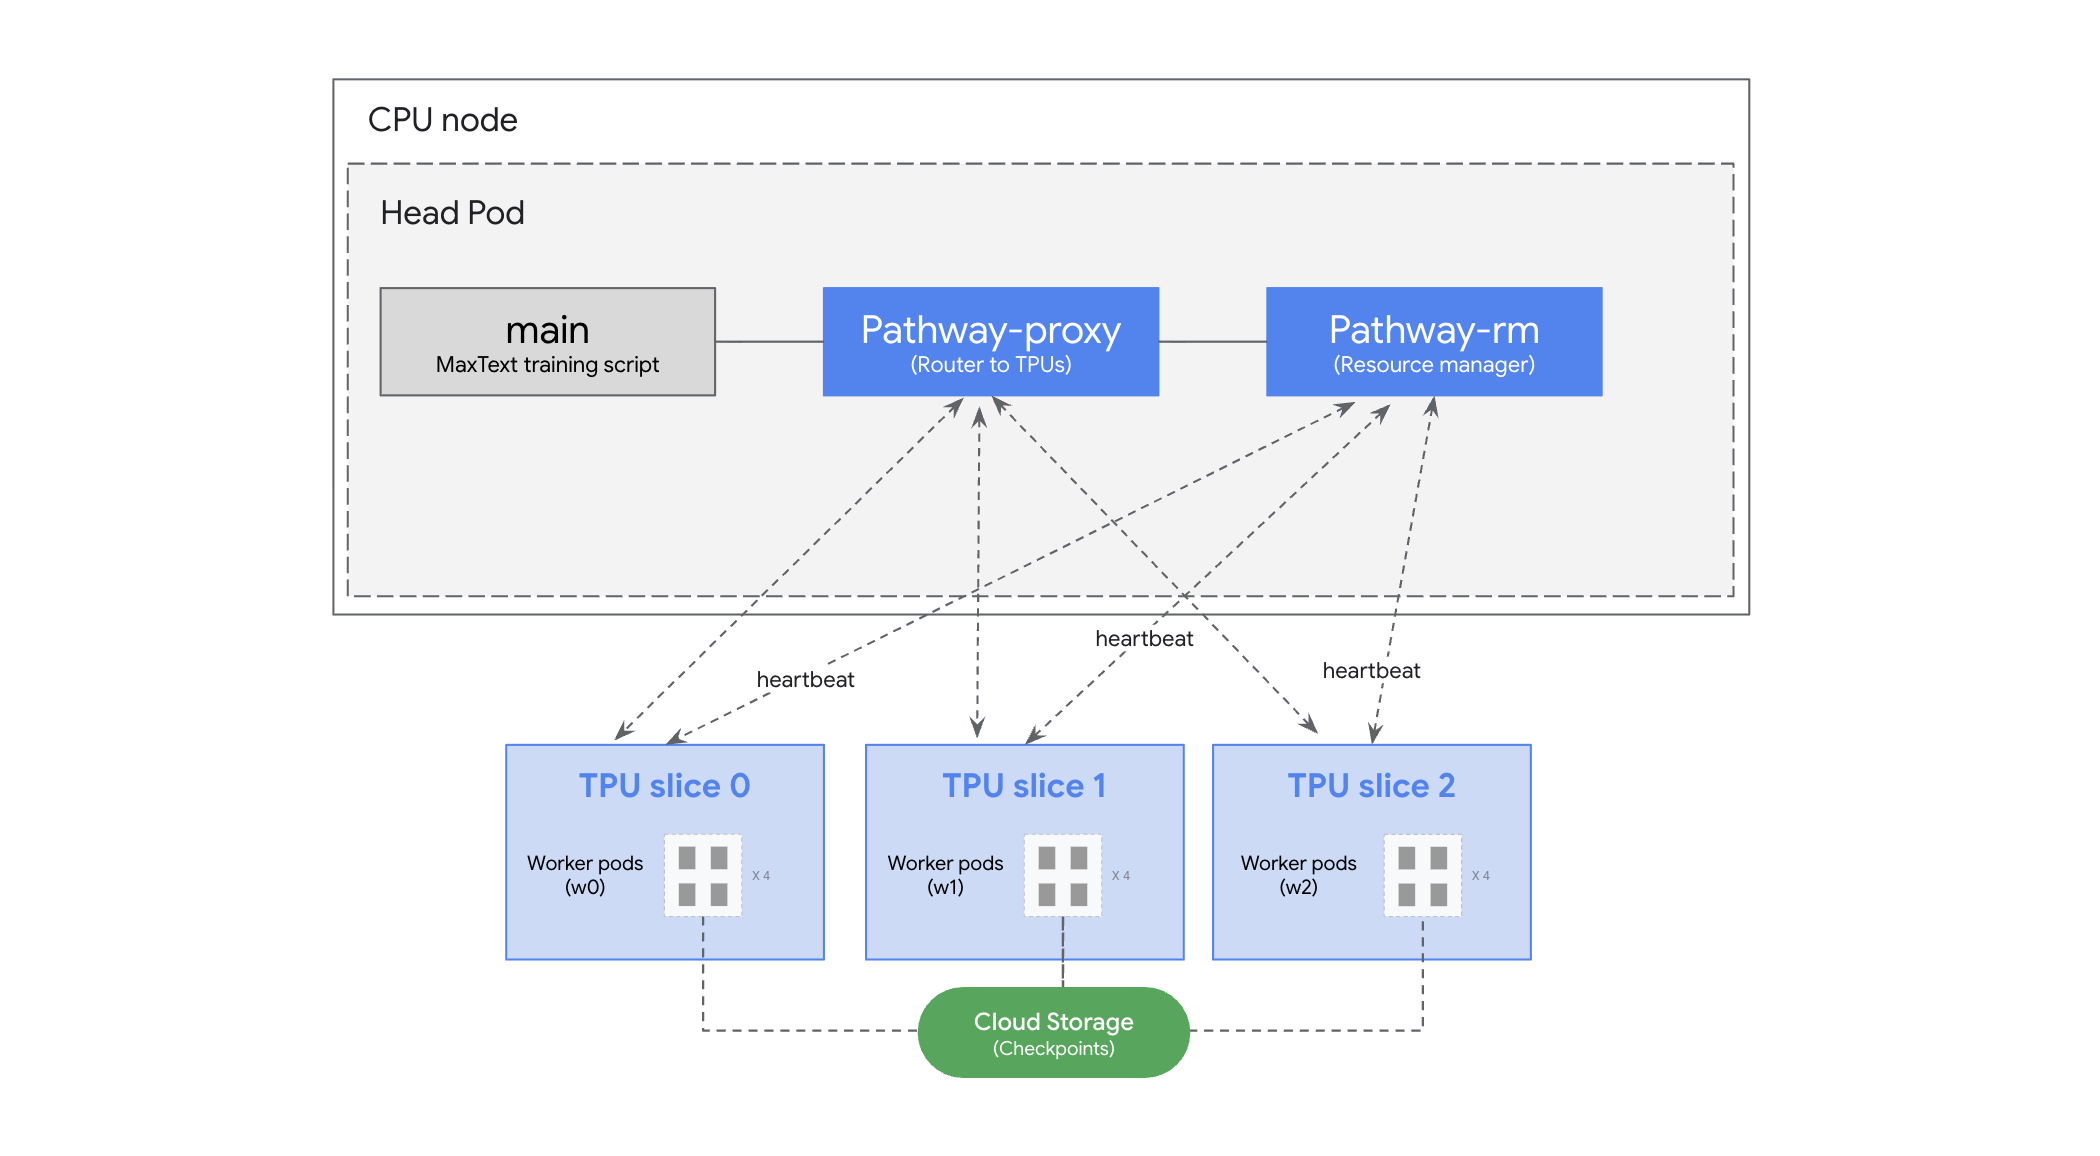
First, Pathways detects the failure. This can surface in two ways. Most commonly, an in-flight operation to the dead worker fails and Pathways returns a DATA_LOSS error. If nothing happens to be in flight, the resource manager (a container running alongside our script on the CPU node) notices the worker has stopped heartbeating and returns DEADLINE_EXCEEDED after about 10 seconds. Either way, the error arrives in our training step as a jax.errors.JaxRuntimeError. The hardware failure has become a catchable Python exception.
Next, the elastic_retry decorator catches the exception. This decorator comes from pathwaysutils; MaxText simply applies it around its training function. It catches that specific exception, logs Slice down event detected. Retrying. message, and runs the recovery path instead of letting the error crash the process.
Finally, Orbax decides what’s safe to restore. This part isn’t unique to elastic training; it’s how Orbax checkpointing works in general, and a full job restart would lean on it in exactly the same way. Checkpoints are written to Cloud Storage in the background while training runs, and a checkpoint is only considered viable when every shard has been flushed and a tiny commit_success marker file is written next to it. During recovery, the cleanup code checks the latest checkpoint directory: if there’s no marker (it was mid-write when things broke), the directory is deleted, and we fall back to the newest checkpoint that does have one. That’s what guarantees we never load half a checkpoint, regardless of how we restart.
With the mechanics clear, let’s actually run it and break something.
Setting up and submitting the elastic training job
We’ll keep our experiment intentionally small so the failure-and-recovery loop is fast to watch. Here is our setup:
- Hardware: 3 x TPU v5e-16 slices = 48 chips, plus one n2-standard-64 CPU node for the controller.
- Platform: Google Kubernetes Engine. Everything runs as pods. The Kubernetes resource that ties it together is a JobSet, which lays out 1 head pod + 12 worker pods and keeps them as one unit.
- Model: qwen3-0.6b. Small on purpose so the failure-and-recovery loop is quick to watch and cheap to run. We’ll cover what changes when you scale to real model sizes in a moment.
- Data: the Glaive function-calling dataset, pre-converted to ArrayRecord shards on Cloud Storage.
- Versions: MaxText at commit 992b4e1, GKE
1.35.3-gke.1993000.
Walking through the whole demo takes about 30 minutes end to end. At on-demand v5e list prices that’s roughly $30 with 48 chips at ~$1.20/chip-hour for half an hour, plus the CPU controller node. The training job itself will run for as long as you configure it to; we just need it active long enough to break it.
Once the cluster is up, we need two things: a MaxText command that runs on the head pod, and a JobSet manifest that wires that command to the TPU slices. Let’s look at each.
The MaxText training command
MaxText can be configured entirely through command-line flags layered on top of a base YAML. Here’s the command our head pod runs, trimmed to the parts that matter for this demo:
python3 -m maxtext.trainers.pre_train.train \
  src/maxtext/configs/base.yml \
  base_output_directory=gs://${BUCKET_NAME}/output \
  run_name=${RUN_NAME} \
  model_name=qwen3-0.6b \
  per_device_batch_size=1 \
  steps=5000 \
  enable_checkpointing=true \
  checkpoint_period=100 \
  enable_single_controller=true \
  elastic_enabled=true \
  elastic_timeout_seconds=300 \
  elastic_max_retries=10 \
  dataset_type=grain \
  grain_file_type=arrayrecord \
  grain_train_files=gs://${BUCKET_NAME}/data/glaive-fc-v2/train.array_record*
Shell
Most of this is standard MaxText. It picks a model, points at data, and sets a batch size. Four flags turn on the elastic behavior:
enable_single_controller=Trueroutes JAX through the Pathways proxy instead of talking to local devices. This is what makes one Python process see all 48 chips, and it’s a hard requirement for everything below.elastic_enabled=truewraps the training function in theelastic_retrydecorator we described earlier and waits for the minimum number of slices before starting.elastic_timeout_seconds=300is how long the retry loop will wait for a failed slice to be replaced before giving up on this attempt.elastic_max_retries=10is how many failures we’ll tolerate over the whole run before exiting for real.
There’s a fifth flag we’re relying on without passing it: elastic_min_slice_count. It controls how many slices must be available before the retry resumes training. The default is -1, which means all of them, and that’s pause and resume, the mode we’re running here. Setting it to a value between 1 and numSlices – 1 would enable replica resize instead, where training keeps going on the surviving slices rather than waiting.
One more flag worth calling out: checkpoint_period=100. MaxText’s default is 10,000 steps. At our ~0.16s per step, 100 steps means a new checkpoint starts roughly every 16 seconds, so there’s always something recent to fall back to. You can go lower still; the right value is a trade-off between step time, checkpoint write time, and how often you expect failures. One caveat: if a slice fails during an active checkpoint write, the current version of MaxText exits rather than retrying. A frequent-enough checkpoint period creates safe windows between writes; alternatively, set enable_continuous_checkpointing=True and let Orbax start the next save as soon as the previous one finishes, so you’re always checkpointing as fast as your storage allows and the fixed period stops mattering.
Submitting the training
The command above doesn’t know anything about Kubernetes. The easiest way to run it across three TPU slices is xpk, which takes a cluster, a TPU type, and your training command, and submits the workload for you. The elastic settings are just two flags:
xpk workload create-pathways \
  --workload=${RUN_NAME} --cluster=${GKE_CLUSTER} \
  --tpu-type=v5litepod-16 --num-slices=3 \
  --docker-image=${MAXTEXT_IMAGE} \
  --elastic-slices=3 --max-slice-restarts=10 \
  --command="python3 -m maxtext.trainers.pre_train.train ... elastic_enabled=true enable_single_controller=True"
Shell
That’s the whole submission. --elastic-slices=3 tells Pathways how many slices may be missing before GKE gives up and restarts the whole JobSet — distinct from the MaxText elastic_min_slice_count above, which is how many slices must be present for the retry to attempt training. --max-slice-restarts is the restart budget. The official elastic training guide uses this xpk path end to end.
Under the hood, xpk wraps your command in a JobSet and hands it to GKE. A JobSet is a single Kubernetes resource that groups several Jobs together and gives them a shared restart policy and a shared headless Service so the pods can find each other by name. That’s exactly what a Pathways cluster needs: one head Job on the CPU node, and one worker Job per TPU slice. With elasticity, recovery is more surgical than a full JobSet restart: when a slice fails, only that slice’s worker Job is recreated, at the Job level — the head Job and the other worker Jobs keep running untouched.
You normally never see this, but it’s worth looking at once, because one line in it bit me later. The full manifest is about 230 lines (mostly env-var plumbing); here’s the shape of it with the parts that matter for elastic training left in:
apiVersion: jobset.x-k8s.io/v1alpha2
kind: JobSet
metadata:
  name: pw-elastic
spec:
  failurePolicy:
    maxRestarts: 20           # whole-JobSet restart budget (last resort)
  replicatedJobs:

  - name: pathways-head     # 1 head pod on the CPU node
    replicas: 1
    template:
      spec:
        template:
          spec:
            initContainers:
            - name: pathways-rm
              image: us-docker.pkg.dev/cloud-tpu-v2-images/pathways/server
              restartPolicy: Always       # runs for the pod's full lifetime
              args:
              - --node_type=resource_manager
              - --instance_count=3
              - --instance_type=tpuv5e:4x4
            - name: pathways-proxy
              image: us-docker.pkg.dev/cloud-tpu-v2-images/pathways/proxy_server
              restartPolicy: Always
              args:
              - --resource_manager_address=$(PATHWAYS_HEAD):29001
              - --num_elastic_slices=3    # from --elastic-slices: tolerate up to 3 missing slices
              resources:
                limits: {memory: 100G}
            containers:
            - name: main
              image: ${MAXTEXT_IMAGE}
              command: [bash, /scripts/train.sh]
              env:
              - {name: JAX_PLATFORMS, value: proxy}
              - {name: JAX_BACKEND_TARGET, value: "grpc://$(PATHWAYS_HEAD):29000"}

  - name: worker            # 3 slices x 4 hosts = 12 worker pods on TPU nodes
    replicas: 3
    template:
      spec:
        backoffLimit: 20      # the key elasticity knob: restart a slice's pods
                              # in place this many times before the worker Job
                              # fails and a full JobSet restart is triggered
        completions: 4
        parallelism: 4
        template:
          spec:
            nodeSelector:
              cloud.google.com/gke-tpu-accelerator: tpu-v5-lite-podslice
              cloud.google.com/gke-tpu-topology: 4x4
            containers:
            - name: pathways-worker
              image: us-docker.pkg.dev/cloud-tpu-v2-images/pathways/server
              args:
              - --resource_manager_address=$(PATHWAYS_HEAD):29001
              resources:
                limits: {google.com/tpu: 4}
HTML
Let’s break it down. The pathways-head Job is the CPU side. Its pod runs three containers: our main container with the MaxText command from above, plus two Pathways containers. The pathways-rm container is the resource manager (it assigns slices to clients, compiles XLA functions, and tracks slice health, among other things), and pathways-proxy is the IFRT proxy that JAX talks to when we set JAX_PLATFORMS=proxy.
The worker Job is the TPU side. replicas: 3 gives us three copies of the Job, one per slice, and completions: 4 / parallelism: 4 puts four pods in each (one per TPU host). Those pods don’t run our code at all. They run the Pathways worker binary, which connects back to the resource manager and waits to be handed compiled XLA programs.
The single most important line for elasticity is backoffLimit: 20 on the worker Job. It lets a failed slice’s pods restart in place — at the Job level — up to 20 times before the worker Job itself is marked failed, which is what would escalate into a full JobSet restart. In other words, a high backoffLimit is what keeps a slice failure local: the slice’s pods come back, the head and the other slices keep running, and you avoid the expensive whole-workload restart. (Sidenote: newer JobSet versions are adding a dedicated job-level restart policy that will express this behavior more directly than backoffLimit does today.)
The one argument that’s specific to elastic training is --num_elastic_slices=3 on the proxy (the in-manifest form of --elastic-slices). We set it equal to the slice count, which tells Pathways it may be missing any number of slices, even all of them, before GKE would give up and restart the JobSet. Losing all of the slices is safe in pause-and-resume mode because recovery state comes from the GCS checkpoint, not from the surviving slices.
One more field worth a glance is limits: {memory: 100G} on the pathways-proxy container. xpk picks a default you can override, though for real model sizes the better answer isn’t a bigger number here — it’s turning on checkpoint persistence, which we get to in the scaling section.
Once the workload is submitted, you can watch it the usual Kubernetes way:
kubectl logs -f -l job-name=pw-elastic-pathways-head-0 -c mainShell
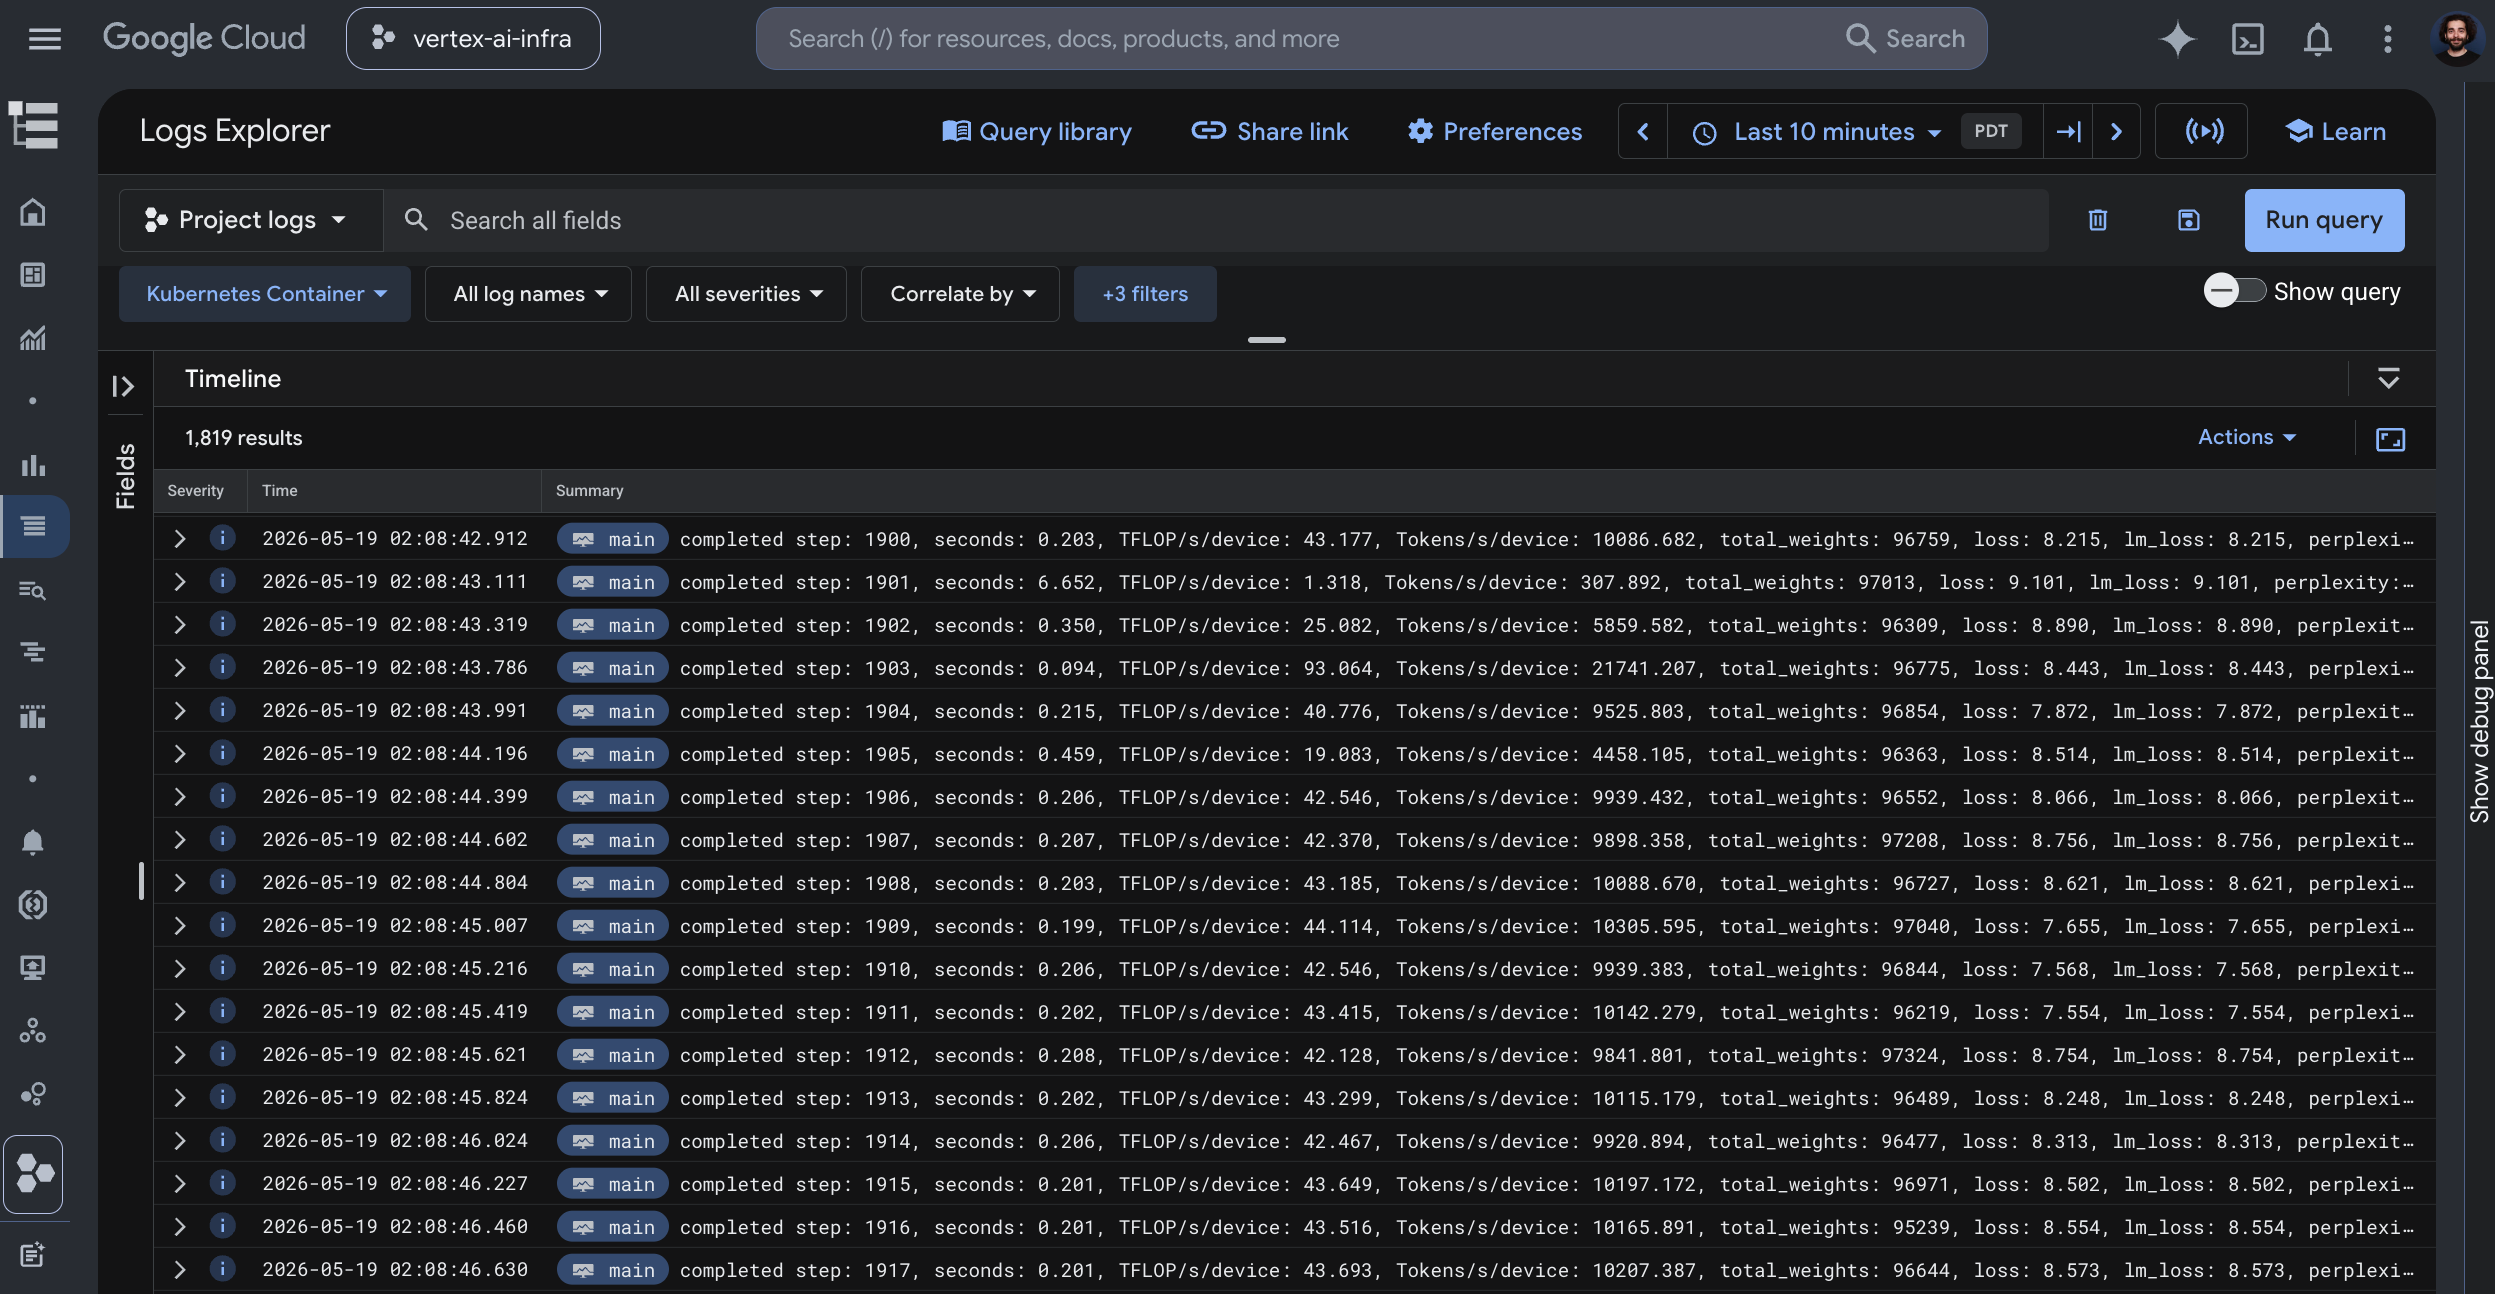
If you’d rather not tail in the terminal, Cloud Logging gives you the same output with search and history that persists through the pod restarts. You can filter on resource.labels.container_name="main". A minute or so later the log starts scrolling: training is running on all 48 chips, loss is dropping, ~43 TFLOP/s per device as shown below.
Now the fun part.
Turn down a worker and watch what happens
Once training has been going for a while and there are a few checkpoints on disk, we pick a worker pod on slice 2 and force-kill it:
kubectl delete pod pw-elastic-worker-2-0-vhhvx --grace-period=0 --forceShell
The --grace-period=0 --force means SIGKILL now. No graceful shutdown, no cleanup. This is how we imitate real hardware failures that don’t give anyone a chance to prepare.
Here’s what happens behind the scenes:
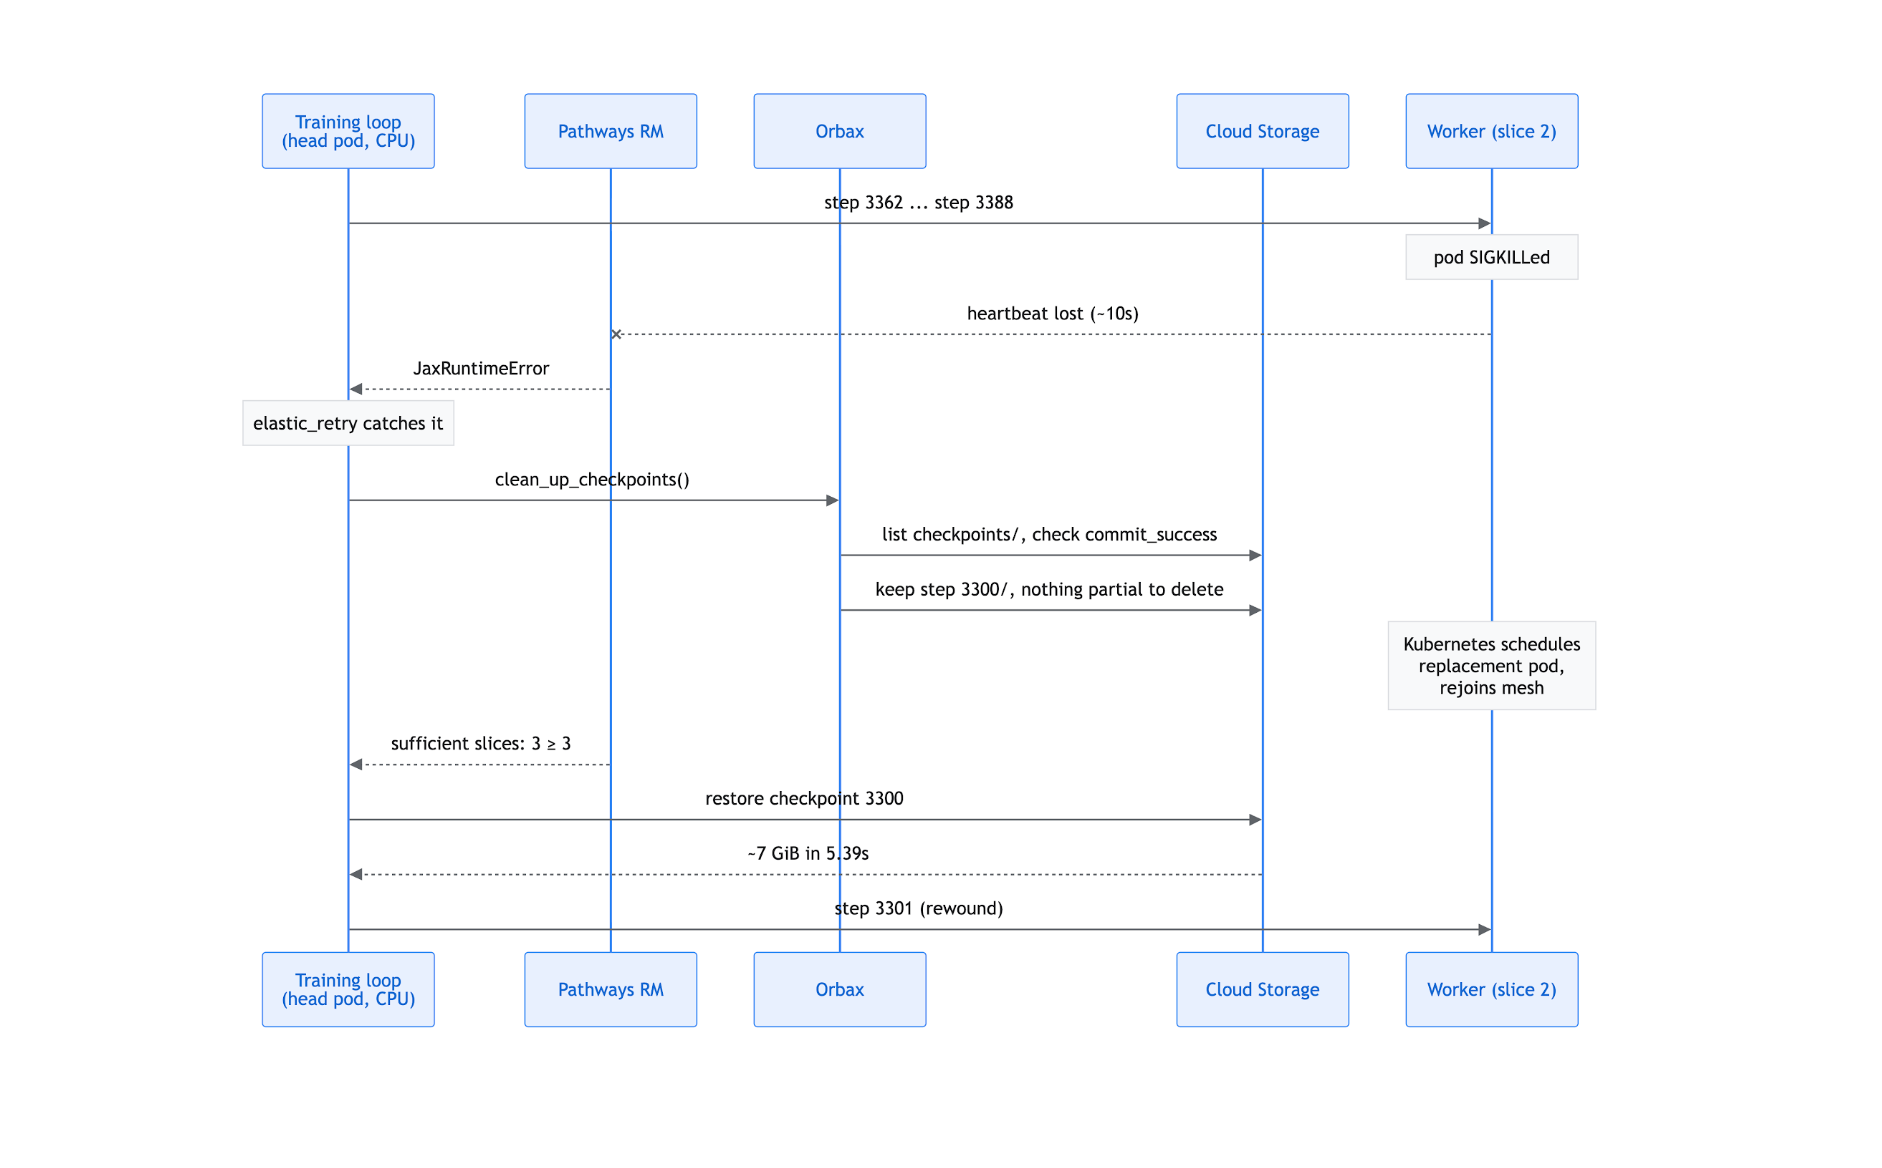
Let’s walk through what the diagram is showing, with a stopwatch running from the moment of the kill.
The first thing to notice is that failure isn’t instant. For about 13 seconds the training loop has no idea anything is wrong: the worker pod is already gone, but the resource manager’s heartbeat window hasn’t closed yet, and JAX dispatch is asynchronous, so steps keep landing all the way up to step 3388. Only when the heartbeat times out does Pathways raise the JaxRuntimeError into our Python process, and elastic_retry catches it with a single log line: Slice down event detected. Retrying.
The handler’s first move is housekeeping. It lists the checkpoint directory on Cloud Storage, sees that step 3300 has its commit_success marker, and confirms there’s nothing half-written to delete. That takes under a second.
Then it waits on infrastructure, not on our code. Kubernetes has to schedule a replacement worker pod onto slice 2, and that pod has to start its container and rejoin the Pathways mesh. In our run that took about 50 seconds, and it’s where most of the wall-clock time goes. At roughly the 64-second mark the log prints Sufficient slices active: 3 >= 3 and the handler re-enters the training function from the top.
Up to this point, what we’re doing looks a lot like a JobSet restart — except for three differences that matter. We only reschedule the one failed slice, not the whole workload; the controller’s Python state can persist across the event if we want it to; and we can be selective about what gets reinitialized (today we reinitialize everything, but that’s a choice, not a requirement).
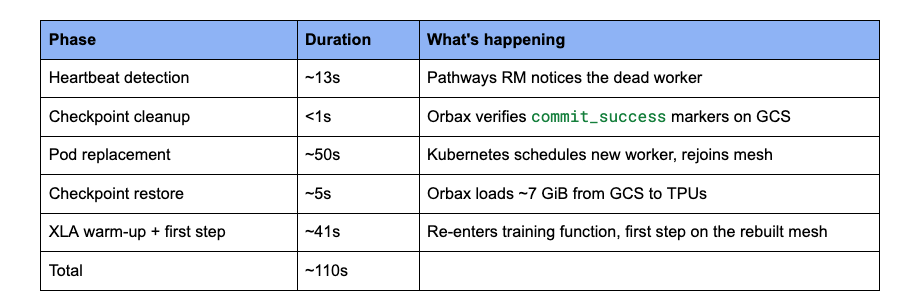
Now the actual restore, and it’s fast. Orbax pulls the ~7 GiB of model and optimizer state back from Cloud Storage and pushes it out to the TPUs in 5.39 seconds — that’s the full wall-clock path, GCS read plus the push to the devices. After a short warm-up — the training function re-entering and running its first step on the rebuilt mesh — the log prints completed step: 3301. That first step took 12.7 seconds, versus ~0.2 once it’s back at steady state. Total time from kill to that line: about 1 minute 50 seconds.
Here’s where that time went:
Below you have logs you would see in the Cloud logging view.
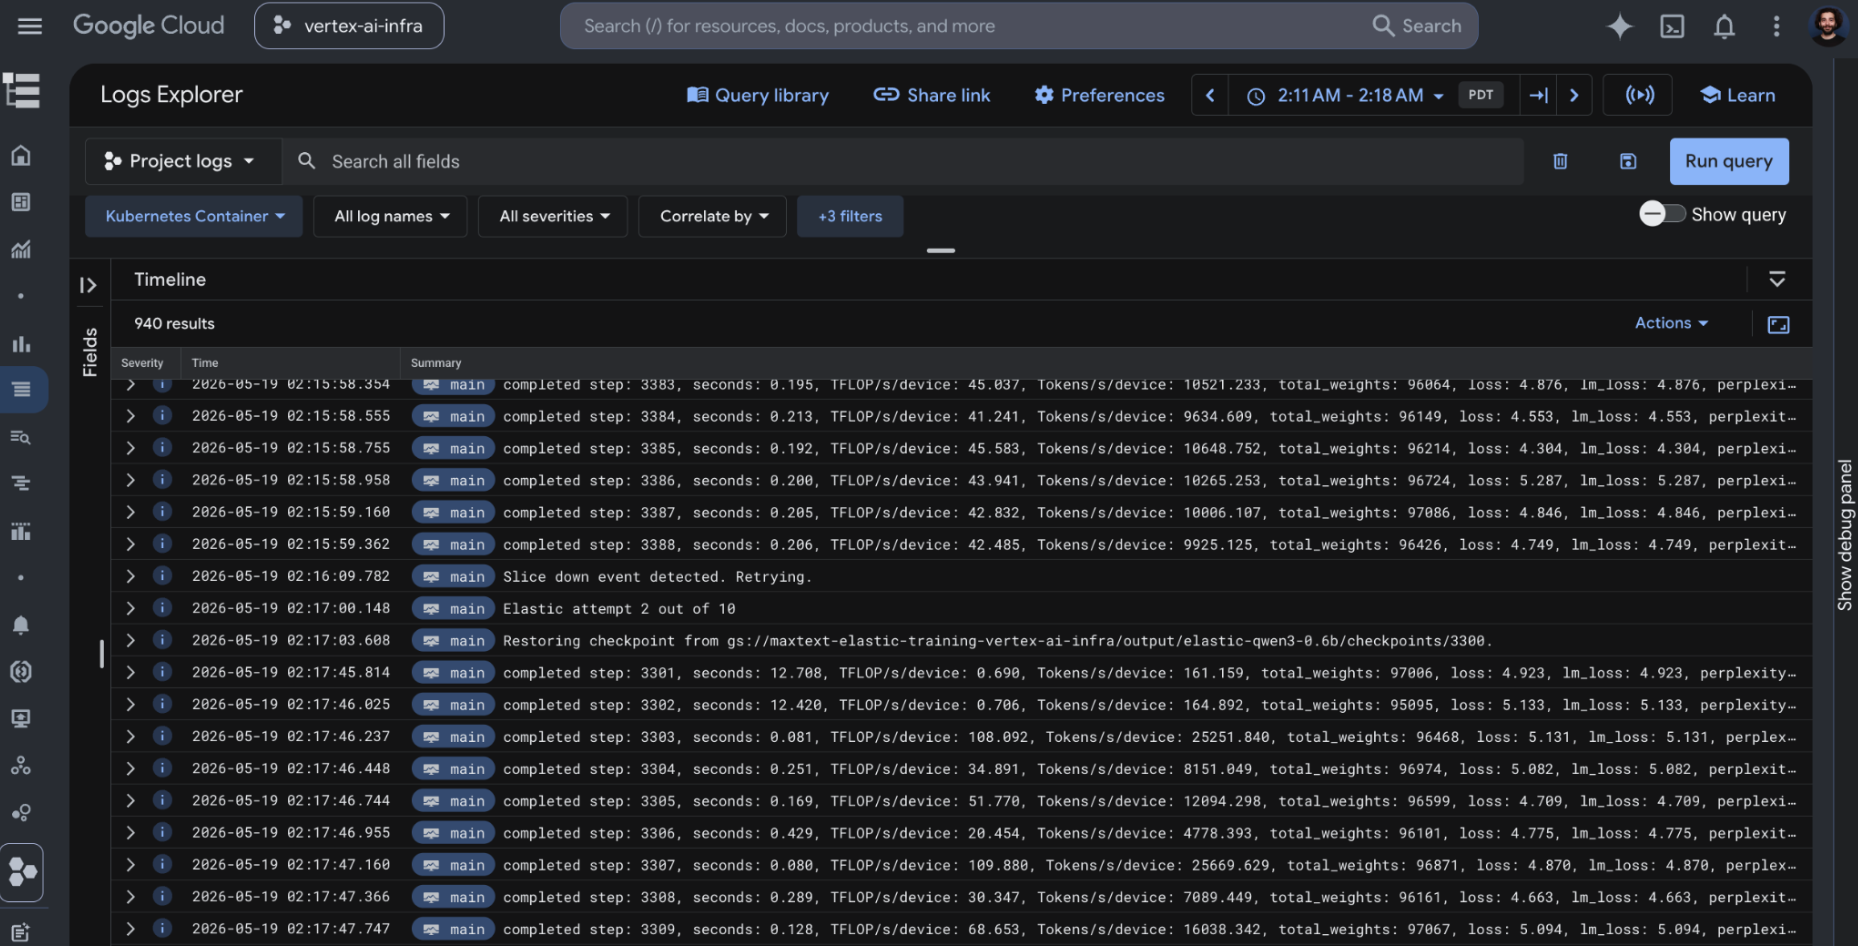
That last line is the whole story. The step counter goes 3388 to 3301 in the same log stream: we lost 88 steps of progress, rewound to the last committed checkpoint at step 3300, and kept going.
Finally, to prove this was in-process recovery rather than Kubernetes quietly restarting everything for us:
$ kubectl get pod <head> -o jsonpath='{...pathways-proxy.restartCount}' #0
$ kubectl get jobset pw-elastic -o jsonpath='{.status.restarts}' #0
Shell
Zero restarts. Same process, same PID, under two minutes of downtime, and almost all of it was waiting for Kubernetes to schedule the replacement worker. For comparison, a full job restart on this same cluster pays for everything we just skipped: tearing down and rescheduling the entire workload — controller and all workers, not just the failed slice — sometimes a full termination grace period, then starting fresh containers and Python processes before it even gets to the checkpoint load. (Compilation is a wash either way — Pathways’ persistent cache means a restart reloads the compiled executables from Cloud Storage instead of recompiling cold.) And a real preemption would add node reprovisioning on top of that.
There’s an even more direct way to convince yourself it’s the same process: keep a plain Python object on the controller, say a list that appends every step’s wall-clock time, and inspect it after recovery. It still has every entry from before the failure. That object lives in CPU memory on the controller, not on any TPU, so an elastic event can’t touch it. If Kubernetes had restarted the pod, it would be empty.
Ok, that’s the happy path. Before we wrap up, let’s talk about what to watch out for when you take this to your own models.
Scaling beyond the demo
Our demo uses Qwen3-0.6B to keep the recovery loop fast to watch and the cost low not because larger models don’t work. They do, but the first time we built this demo on a larger model (Qwen3-4B) we ran into a checkpoint-through-proxy bottleneck that’s worth understanding before you scale up. Here’s what happened, and how to avoid it.
By default, when elastic_retry recovers from a failure, Orbax restores the checkpoint into host RAM on the CPU controller and then JAX pushes those arrays through the pathways-proxy container out to the TPUs. This controller-routed path works fine when the checkpoint is small. But with a larger model, like Qwen3-4B where params plus Adam optimizer moments add up to about 135 GiB, the proxy has to buffer all of that in flight, and the proxy OOM-kills and recovery fails. In our case the proxy was set to 100 GB, the checkpoint was 135 GiB, and recovery would fail every time.
The fix is not to give the proxy more memory. A proxy OOM is a signal that you’re routing the whole checkpoint through the controller — which you don’t want to be doing at scale in the first place. The right answer is to take the controller out of the data path: set ENABLE_PATHWAYS_PERSISTENCE=1 in the controller’s environment. This tells the Pathways Persistence API to have each TPU host read and write its own checkpoint shards directly to Cloud Storage. The bytes never funnel through the controller’s proxy at all, so the proxy’s memory limit stops mattering — and you get faster, parallel checkpoint I/O as a bonus. This is the recommended path and it works today. (You could instead just raise limits: {memory: ...} on the proxy to clear the OOM, but that only masks it: you keep the slow controller-routed path and miss the performance win, so treat it as a stopgap, not a fix.)
Looking further ahead, MaxText is adding Colocated Python, which runs the Orbax save and restore code on the TPU hosts themselves — combining direct-to-storage I/O with the flexibility of running arbitrary Python on the accelerator VMs. This is still in preview: the base images need manual allowlisting today, so it’s not something you can pick up out of the box yet. We mention it here so you know where things are heading, not as a step to follow.
Our demo sidesteps all of this because qwen3-0.6b’s checkpoint is only ~6.7 GiB, well under the proxy limit. With persistence enabled, elastic recovery works the same way at much larger checkpoint sizes.
What’s next: snapshot-based elasticity
Everything in this post recovers from a checkpoint on Cloud Storage. That’s why the rewind is bound by your checkpoint period. We lost 88 steps because the last committed checkpoint was at step 3300 and why a chunk of the recovery time goes into reading state back from GCS.
The next iteration of elasticity removes that round-trip. Instead of rebuilding from the latest GCS checkpoint, the elastic manager periodically saves a snapshot of the training state into host memory, kept alongside the live process. When a slice drops, recovery reloads from that in-memory snapshot rather than from Cloud Storage. Two things get better: you rewind only to the last snapshot (which can be far more frequent than a full checkpoint, since it never touches storage), and you skip the GCS read on the way back. The same machinery also handles resharding down onto the surviving slices and back up when replacements arrive with the replica-resize path, driven from snapshots rather than checkpoints.
It’s the same idea we’ve walked through here with a slice failure becoming a short rewind, not a full restart and with the rewind made smaller and the recovery made faster. That’s the subject of the next post, so keep an eye out.
Conclusion
At the scale and duration of real training runs, hardware failure isn’t an edge case. It’s a certainty you have to plan for. The usual plan is to checkpoint often and eat a full restart when a slice dies. Elastic training changes that: the failure becomes a catchable exception inside a process that never exited, so recovery is a short rewind on the same controller instead of a cold relaunch of the whole workload.
That’s what we walked through. A single worker force-killed mid-run, training back at the next step in under two minutes, zero JobSet restarts using pause and resume, the simpler of the two recovery paths Pathways offers. Replica resize, the other path, keeps training going on the surviving slices instead of waiting, and is available today as well.
You can test this workflow yourself today. All the necessary code and step-by-step instructions are available in our elastic training guide in the MaxText docs.
For now, thanks for reading! I hope this made you a little curious about what’s possible with JAX and MaxText on Cloud TPUs. If you run the demo and it breaks, let me know on LinkedIn or X.
Happy training!