Key takeaways
- A social media dashboard consolidates performance data from every platform into one view, so you can track metrics, spot trends, and report results without switching between apps.
- Different dashboard types serve different goals, from awareness and engagement tracking to competitive analysis, executive reporting, and employee advocacy. Pick the template that matches your objectives.
- The most effective dashboards focus on specific KPIs tied to business objectives, not just vanity metrics, making it easier to prove social media ROI to leadership.
- You can build a basic dashboard for free with Google Looker Studio, or use a platform like Hootsuite for pre-built templates with cross-platform analytics and AI-powered insights.
A social media dashboard is a centralized tool that pulls metrics from all your social media accounts into one visual interface for tracking, analyzing, and reporting on performance.
Instead of logging into Instagram, LinkedIn, Facebook, TikTok, and X separately to check results, a dashboard brings everything together. You get a single view of what’s working, what’s not, and how your social efforts connect to business goals.
Most dashboards include real-time or near-real-time data, customizable visualizations (charts, graphs, tables), and the ability to filter by platform, date range, campaign, or metric. They range from free tools like Google Looker Studio to all-in-one platforms like Hootsuite that combine scheduling, publishing, and cross-platform analytics in one place.
With over $121 billion in US social ad spending projected for 2026, social media dashboards aren’t just nice to have. For enterprise teams managing multiple accounts, campaigns, and stakeholders, they solve real operational problems.
Faster, easier reporting
Switching between native analytics on every platform to compile a monthly report can eat up hours. A dashboard lets you export all the data and visualizations you need for presentations and reports in minutes, not hours. That time goes back into strategy and execution.
Real-time decision-making
When performance data is scattered, you’re always reacting late. A dashboard gives you an at-a-glance view of what’s working (and what’s not), so you can pivot your social media strategy when it actually matters. AI-enhanced insights can surface trends and anomalies you might otherwise miss.
Proving social media ROI to leadership
One of the biggest challenges for social teams is connecting their work to business outcomes, especially when 59% of CMOs report insufficient budget to execute their strategy. A dashboard lets you view performance in context with historical data, track progress toward business goals over time, and present the data leadership needs to see, including social media metrics tied to revenue, leads, and brand health.
The metrics on your dashboard should map directly to your goals. Tracking everything leads to dashboard clutter. Tracking the right things leads to better decisions.
Here’s a quick reference for matching goals to metrics and the dashboard type that fits:
|
Goal |
Key metrics |
Dashboard type |
|---|---|---|
|
Awareness |
Reach, impressions, follower growth |
Brand awareness dashboard |
|
Engagement |
Engagement rate, likes, comments, shares, saves |
Content and engagement dashboard |
|
Conversions |
Link clicks, UTM-tracked traffic, conversion rate |
Conversions and traffic dashboard |
|
Customer service |
CSAT score, response time, resolution rate |
Social customer service dashboard |
|
Competitive intelligence |
Share of voice, competitor engagement, benchmarks |
Competitive analysis dashboard |
|
Executive reporting |
ROI, revenue impact, goal progress, sentiment |
Executive summary dashboard |
|
Paid social |
CPC, CPA, ROAS, CPM |
Advertising and paid social dashboard |
A strong social media analytics dashboard also includes historical context, so you can compare current performance to previous periods and track progress over time. The templates below show these metrics in action.

Brand awareness dashboard

This social media dashboard template shows how much your audience interacts with your social media posts and accounts, plus how engagement, reach, and follower count has changed over time. For enterprise teams, awareness tracking is especially valuable for measuring the impact of brand campaigns and understanding how your audience is growing across regions or segments.
Why you need it: Understand how much of your current audience interacts with your organization, and how often. Track awareness growth over time to inform social media strategy decisions.
Metrics to track:
- Follower growth
- Engagement rate
- Impressions
- Reach
- Likes
- Comments
- Shares
- Link clicks (on supported social media platforms)
- DM automations (on supported social media platforms)
Conversions and traffic dashboard

This social media dashboard tracks link clicks across platforms. Tracking is limited by each platform’s capabilities (e.g., Instagram doesn’t offer clickable links in posts), but provides a good overview of click conversions, including clicks by media format, trends, and more on Facebook, LinkedIn, and Pinterest.
For full-funnel measurement, pair your dashboard data with Google Analytics or your CRM to connect social clicks to downstream actions like signups, purchases, or pipeline.
Why you need it: Know the true ROI of your social media management efforts and speak to the business results social media is driving for your organization. Track clicks and traffic over time to show impact and justify trying new ideas and more investment in social media marketing.
Metrics to track:
- Link clicks (web traffic)
- UTM link parameters
- Hashtag, post, and profile clicks (depending on platform availability)
Content and engagement performance dashboard

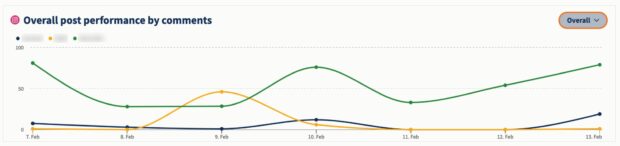
This dashboard combines two views that work best together: overall engagement rate trends and individual post performance. You can track engagement rate by platform and per post, find your top performing content sorted by the metric of your choice, and see which content formats are driving the most interaction.
Engagement rate isn’t a vanity metric. It’s a direct representation of how well your content resonates with your audience. Pairing it with post-level performance data helps you tweak your strategy when necessary and understand if your experiments are working.
Why you need it: Quickly identify your best performing content and understand what’s driving results. Effectively repurpose top posts or use Hootsuite’s built-in AI tools to brainstorm related new content ideas to fill your content calendar with what’s working.
Metrics to track:
- Engagement rate for the previous 30 days (per platform)
- Engagement rate per post
- Top social media posts over the previous 30 days, sorted by highest engagement rate
- Likes, comments, saves, shares
- Impressions/views
- Performance by post format (e.g., Reels vs. Stories, carousels vs. photos)
Network-specific dashboards

This shows Hootsuite’s Instagram overview report template. Network-specific social media analytics dashboards for all supported platforms are included in all Hootsuite plans.
Overall performance dashboards are important for understanding how your entire social strategy is working and how your activity on each platform contributes to that success. But you also need to deeply understand each platform you’re on, including why you’re on it, what content people expect to find there, and trends on each platform. Even with a cross-platform view, platform-specific analysis reveals nuances that aggregate data can hide.
Why you need it: Understand how each platform contributes to your business goals. Measure which content formats and topics perform the best on each platform, so you can optimize your strategy and get results faster.
Metrics to track:
- Engagement metrics for one platform (likes, comments, shares, saves, clicks, views, etc).
- Follower growth rate and demographics.
- Top performing content: Track performance of formats (e.g. Reels, photo, text, carousel, etc) and topics (e.g. memes, educational, promotional, content about a specific topic in your industry, etc).
To easily measure content performance, create custom tags in Hootsuite Analytics to label content by goal or topic. For Hootsuite’s own Social Media Lead, Trish Riswick, tags are crucial:
We tag our posts according to which of our three pillars they belong to, then pull analytics reports for each of those tags. That allows us to track performance by pillar and goal, as well as all the overall, built-in reports in Hootsuite Analytics.
Social listening dashboard
Social listening data improves everything from your content strategy to protecting your brand reputation, improving customer service, and proving ROI.
Hootsuite Listening analyzes millions of social media conversations in real time and provides AI-powered summaries, so you can quickly get the data you need to make decisions, uncover trends, and understand how people feel about your brand, or any topic.
Why you need it: Get the data you need to make informed decisions to improve your social media strategy. Understand your audience, what they want, and what’s working (and what isn’t) so you can get real business results from your social media channels faster, and prove it.
Metrics to track:
- Social mentions: Track mentions of your brand or product name across social media and the web, whether people tag you or just type your name in a caption.
- Brand sentiment: Spot spikes in positive or negative sentiment to identify potential crises, or opportunities to capitalize on positive publicity.
- Competitive intelligence: Know what will trend before your competitors, and track sentiment about your competitors as well as benchmarks, so you always stay ahead.
Competitive analysis dashboard
Keep your finger on the pulse of your competition with customized competitive analysis social media dashboards in Hootsuite. View your social media performance against industry benchmarks and against specific competitors, plus see follower growth, brand sentiment, and trends across your niche.
Competitive benchmarking data doesn’t just tell you where you stand. It informs content strategy, helps justify budget requests, and reveals gaps your competitors haven’t filled yet.
Why you need it: Understand how your social media performance compares to your most important competitors and industry averages.
Metrics to track:
- Net follower gain or loss over time.
- Post engagement, including average engagement rates, likes, views, comments, shares, and more.
- Your performance against industry benchmarks.
- Audience demographics and how those compare to your competitors.
Social customer service dashboard
Social media customer service is becoming an expectation for many people: 81% of customers now expect faster service thanks to new tech. Using automated customer service chatbots, creating separate social channels for customer service, or leveraging automated DMs are a few ways to meet your customers where they are.
Why you need it: Evaluate the effectiveness of your social media customer service initiatives and find ways to improve. Plus, prove the ROI of your social media customer care strategy to leadership.
Metrics to track:
- Customer satisfaction score (CSAT) results over time.
- Customer service wait times.
- Brand sentiment over time.
- If you use automated customer service chatbots: escalation rate (how many times customers asked to speak to a person) and resolve rate (how many conversations the chatbot was able to resolve).
Hootsuite can measure all this while powering your entire social customer service program. Check out how Inbox 2.0 saves you time while delighting your customers.

Executive summary dashboard

While you may enjoy diving deep into analytics tools, your leaders likely prefer high-level summaries. They want to know how social media is performing but they don’t need to know every detail. Having an executive summary social media dashboard means you can whip up a status report on the metrics that matter in minutes, not hours.
Hootsuite includes a built-in social performance score on all plans that shows a weekly or monthly snapshot of your social media performance across Facebook, Instagram, and LinkedIn. It’s your instant snapshot of audience growth trends, what content resonates most, average engagement, and ad campaign performance for all your profiles over the last 30 days. Use it as a starting point, or customize a more detailed executive report.
Always be ready to show ROI, speak to your team’s work, or answer the question, “Did we go viral this month?”
Why you need it: Always have a succinct report ready to show your leaders that includes key metrics and actionable insights alongside what each one means for the organization.
Metrics to track:
The exact metrics you track will depend on your goals and current social media campaigns. Want something to start from? Grab our free social media report template and customize it to suit your needs.
Example metrics include:
- Basics: Impressions, reach, views, net follower gain/loss
- Engagement: Top posts, likes, comments, shares, video views, engagement rate (per post and average)
- Brand related: Sentiment over time, social mentions
- Campaign related: Performance for current or recently completed organic and paid campaigns
- Conversion metrics: Link clicks
- Advertising metrics (optional): Ad spend, cost-per-click (CPC), reach, conversions
- Goal specific: Metrics you’re using to measure your current social media goals. For example, if your goal is to boost your engagement rate on Instagram, show average engagement rate over time alongside metrics like impressions, and a comparison of your Instagram engagement rate vs. key competitors’ engagement rates.
Employee advocacy dashboard

Employee advocacy programs help you get even more out of your most important asset, your people, by engaging them as brand ambassadors. This means having pre-approved content employees can share to their own social media profiles, organically expanding your reach and building trust.
Formal employee advocacy programs, like those running on Hootsuite Amplify, make creating these pre-approved content libraries easy, plus analytics to measure program success and business impacts. But you can also take an informal approach by encouraging employees to share content from your company profiles.
Why you need it: Building trust with your audience is crucial for both social media success and overall business success. Besides big gains in reach, employee advocacy also keeps your employees connected to your brand and engaged as partners in achieving business goals.
Calculate your potential reach expansion with our employee advocacy calculator.
Metrics to track:
- Adoption rate: The percentage of your employees enrolled in the program.
- Share rate: The percentage of enrolled employees who share content from the platform.
- Top contributors: The employees sharing the most content. Reward their activity!
- Financial impact: Leads and sales resulting from employee-shared content.
- Content-related social media metrics: Reach, engagement rate, traffic from employee-shared posts.
Advertising and paid social dashboard
Besides planning and scheduling your organic and paid content together in Hootsuite, you can also view performance side-by-side. That way you get a holistic view of all your social media marketing together and can see how organic content impacts your ad performance, and vice versa.
Why you need it: With global social media ad spending on pace to reach $480 billion by 2030, seeing all your paid ad performance quickly lets you uncover actionable insights in time to make real impacts on your campaigns before they end.
Metrics to track:
- Cost per click (CPC)
- Cost per acquisition (CPA)
- Cost per mille (CPM) a.k.a. cost per 1,000 impressions
- Return on ad spend (ROAS)
- Conversion rate
- Engagement rate
- Relevance and quality scores: Each platform has their own scoring system that can impact your ad reach. For example, Meta calls it “Quality Ranking.”
Having the right dashboard template is a great start, but how you set it up and maintain it makes the difference between a tool that drives action and one that collects dust. Here are five best practices to keep your dashboards useful.
- Start with a specific goal, not “track everything.” Each dashboard should answer a clear question, like “How is our Instagram engagement trending?” or “What’s the ROI of our latest campaign?” Dashboards that try to cover everything end up highlighting nothing.
- Match the dashboard to the audience. A dashboard for your social team should include granular, day-to-day metrics. A dashboard for your VP of Marketing should focus on high-level KPIs, trends, and business impact. Design for the person reading it.
- Set a review cadence. Decide how often to review each dashboard. Weekly check-ins work well for ongoing performance. Daily reviews make sense during active campaigns. Monthly deep-dives are best for strategic reporting to leadership.
- Use historical benchmarks for context. A number without context is just a number. Include year-over-year and previous-period comparisons so you can tell whether performance is improving, declining, or holding steady.
- Keep it visual and scannable. The best dashboards follow the 5-second rule: anyone viewing it should be able to grasp the key takeaway within five seconds. Use clear labels, consistent color coding, and limit each view to the metrics that matter most.

You can create a social media dashboard for free using Google Looker Studio, though it requires some manual setup and ongoing maintenance. Here’s how to do it in six steps:
- Log in to Google Looker Studio
- Create a data source
- Enter your business info
- Connect Google Analytics
- Create your dashboard
- Add metrics and finalize

You’ll need three things to get started:
- A Google account
- A Google Analytics 4 property connected to your website
- Ample spare time
Now here’s what to do.
Step 1: Log in to Google Looker Studio. Go to Looker Studio and sign in with your Google account.

Step 2: Create a data source. At the top left, click Create, then Data source.

Step 3: Enter your business info. Enter your country and business name. Agree to the terms and click Continue.

Step 4: Connect Google Analytics. Choose the Google Analytics connection from the list of available data sources. Then click Authorize, choose your Analytics account, and click Connect at the top right.

Step 5: Create your dashboard. After connecting your Analytics account, you’ll see a dense data view that isn’t immediately useful. To start turning this into something you can actually use, click Create report at the top right.
Instead of overwhelming data, you’ll see a blank canvas.

Step 6: Add metrics and finalize. You’ll need to add metrics to your custom social media dashboard one by one from the list of 400+ metrics on the right side. Position them, add headings, and adjust the layout as you go.

Your end result will be a perfectly customized social media dashboard that includes all the metrics you care about most, and nothing you don’t. However, getting that for free comes at a cost: your valuable time spent building this report by hand, and the lack of automatic updates as platforms evolve.
Not all dashboard solutions are created equal. The right choice depends on your team size, the number of platforms you manage, and how much time you want to spend on setup and maintenance.
Here are the key features to evaluate:
- Cross-platform support: Can it pull data from all the social networks you use?
- Custom reporting: Can you build reports tailored to different stakeholders?
- AI-powered insights: Does it surface trends and recommendations automatically?
- Team collaboration: Can multiple team members access and share dashboards?

Frequently asked questions
What is the difference between a social media dashboard and social media analytics?
A social media dashboard is a tool that visualizes performance data from multiple platforms in one place, while social media analytics refers to the broader practice of measuring, analyzing, and interpreting social media data. Dashboards are one way to access and present analytics, but analytics can also include deeper analysis like attribution modeling, audience segmentation, and predictive insights that go beyond what a dashboard displays.
How often should enterprise teams update their social media dashboards?
Enterprise teams should review their social media dashboards at multiple cadences depending on the dashboard type. Daily reviews work best during active campaigns to catch performance issues early. Weekly check-ins help track ongoing performance trends and inform content strategy. Monthly or quarterly reviews are ideal for executive reporting and strategic planning. Most modern dashboard tools update data automatically in real-time or near-real-time, so the focus should be on reviewing and acting on the data, not manually updating it.
Can you track ROI with a social media dashboard?
Yes, you can track social media ROI with a dashboard, but it requires connecting your dashboard to data beyond social platforms. Track metrics like link clicks, UTM parameters, and conversion events within your dashboard, then integrate with Google Analytics, your CRM, or marketing automation platform to connect social activity to revenue, leads, and customer acquisition costs. The most effective ROI dashboards combine social engagement metrics with business outcomes to show the complete picture.
What metrics should an enterprise social media dashboard prioritize?
An enterprise social media dashboard should prioritize metrics tied directly to business objectives rather than vanity metrics. Focus on engagement rate (not just follower count), conversion metrics like link clicks and UTM-tracked traffic, brand sentiment and share of voice for reputation management, customer service metrics like response time and CSAT scores, and paid social performance including ROAS and CPA. The specific mix depends on your goals, but enterprise dashboards should always connect social activity to business impact.
Do you need different dashboards for different stakeholders?
Yes, different stakeholders need different dashboards. Social media managers need granular, day-to-day metrics like post-level performance, engagement rates, and publishing schedules. Marketing directors need campaign performance, competitive benchmarks, and trend analysis. Executives need high-level KPIs, ROI data, and goal progress tied to business objectives. Creating stakeholder-specific dashboards ensures each audience gets the information they need without overwhelming them with irrelevant details.
Save time managing your social media marketing strategy with Hootsuite. Publish and schedule posts, find relevant conversions, measure results, and more — all from one dashboard. Try it free today.