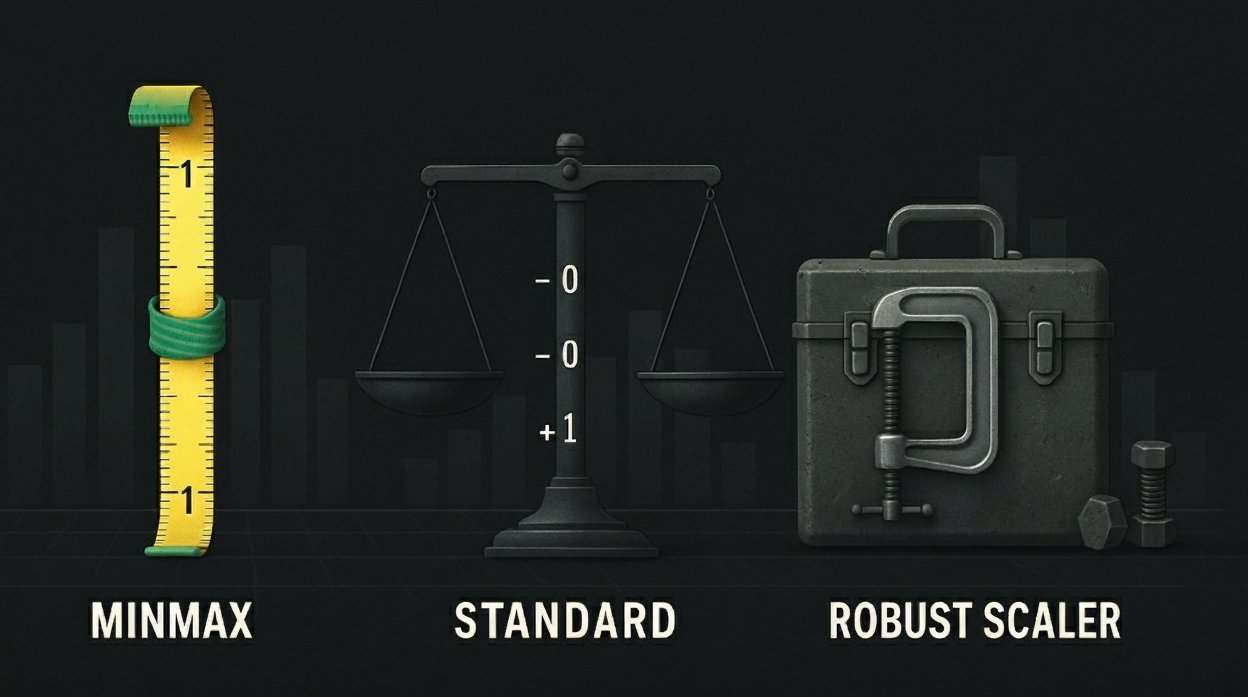
In this article, you will learn how MinMaxScaler, StandardScaler, and RobustScaler transform skewed, outlier-heavy data, and how to pick the right one for your modeling pipeline.
Topics we will cover include:
- How each scaler works and where it breaks on skewed or outlier-rich data
- A realistic synthetic dataset to stress-test the scalers
- A practical, code-ready heuristic for choosing a scaler
Let’s not waste any more time.
MinMax vs Standard vs Robust Scaler: Which One Wins for Skewed Data?
Image by Editor
Introduction
You’ve loaded your dataset and the distribution plots look rough. Heavy right tail, some obvious outliers, and that familiar sinking feeling that your model performance is sure to be suboptimal. Been there?
Choosing the right scaler for skewed data isn’t just about following best practices. It’s about understanding what each method actually does to your data and when those transformations help versus hurt your model’s ability to learn meaningful patterns.
In this article, we’ll test MinMaxScaler, StandardScaler, and RobustScaler on realistic data, see exactly what happens under the hood, and give you a practical decision framework for your next project. Let’s begin!
Understanding How Common Data Scalers Work
Let’s start by understanding how the different scalers work, their advantages and disadvantages.
MinMax Scaler
MinMax Scaler squashes everything into a fixed range, usually [0,1], using your data’s minimum and maximum values.
scaled_value = (value – min) / (max – min)
MinMaxScaler has the following advantages:
- Bounded output range [0,1]
- Preserves original data relationships
- Fast and simple to understand
The problem: Extreme outliers make the denominator massive, compressing most of your actual data into a tiny fraction of the available range.
Standard Scaler
Standard Scaler centers data around zero with unit variance by subtracting the mean and dividing by standard deviation.
scaled_value = (value – mean) / standard_deviation
StandardScaler has the following advantages:
- Works great with normally distributed data
- Centers data around zero
- Well-understood by most teams
The problem: Both mean and standard deviation are heavily influenced by outliers, skewing the scaling for normal data points.
Robust Scaler
Robust Scaler uses the median and interquartile range (IQR) instead of the mean and standard deviation, which are susceptible to outliers.
scaled_value = (value – median) / IQR
IQR = Q3 – Q1
where:
- Q1 = First quartile (25th percentile) – the value below which 25% of data falls
- Q3 = Third quartile (75th percentile) – the value below which 75% of data falls
RobustScaler has the following advantages:
- Resistant to outliers
- Uses percentiles (25th and 75th) that ignore extreme values
- Preserves data distribution shape
The problem: It has an unbounded output range, which can be less intuitive to interpret.
Creating Sample Data
Let’s create a dataset that actually reflects what you’ll encounter in production. We’ll combine three common data patterns: normal user behavior, naturally skewed distributions (like revenue or page views), and those extreme outliers that always seem to sneak into real datasets. We’ll use NumPy, Pandas, Matplotlib, and SciPy.
|
1 2 3 4 5 6 7 8 9 10 11 12 13 14 15 16 17 18 19 20 21 22 23 24 25 26 27 28 29 30 31 32 33 34 35 36 37 38 |
import numpy as np import pandas as pd import matplotlib.pyplot as plt from sklearn.preprocessing import MinMaxScaler, StandardScaler, RobustScaler from scipy import stats
np.random.seed(42)
# Simulate typical user behavior patterns normal_data = np.random.normal(50, 15, 800)
# Add natural skew (common in revenue, pageviews, etc.) skewed_data = np.random.exponential(2, 800) * 10 + 20
# Include inevitable extreme outliers outliers = [200, 180, 190, 210, 195]
# Combine into one messy dataset data = np.concatenate([normal_data, skewed_data, outliers]) df = pd.DataFrame({‘original’: data})
# Apply all three scalers scalers = { ‘MinMax’: MinMaxScaler(), ‘Standard’: StandardScaler(), ‘Robust’: RobustScaler() }
for name, scaler in scalers.items(): df[name] = scaler.fit_transform(df[[‘original’]]).flatten()
# Check what we’re working with print(“Original Data Stats:”) print(f“Mean: {df[‘original’].mean():.2f}”) print(f“Median: {df[‘original’].median():.2f}”) print(f“Std Dev: {df[‘original’].std():.2f}”) print(f“Skewness: {stats.skew(df[‘original’]):.2f}”) print(f“Range: {df[‘original’].min():.1f} to {df[‘original’].max():.1f}”) |
Here’s the info for the sample dataset:
|
Original Data Stats: Mean: 45.65 Median: 42.81 Std Dev: 20.52 Skewness: 2.07 Range: 1.4 to 210.0 |
What Actually Happens During Data Scaling
Let’s take a look at the numbers to understand exactly what each scaler is doing to our data. The statistics will reveal why some scalers fail with skewed data while others handle it quite well.
Effect of MinMax Scaler on Sample Data
First, let’s examine how MinMaxScaler’s reliance on min/max values creates problems when outliers are present.
|
print(“=== MinMaxScaler Analysis ===”) min_val = df[‘original’].min() max_val = df[‘original’].max() print(f“Scaling range: {min_val:.1f} to {max_val:.1f}”)
# Show the compression effect percentiles = [50, 75, 90, 95, 99] for p in percentiles: pct_val = df[‘MinMax’].quantile(p/100) print(f“{p}% of data falls below: {pct_val:.3f}”)
data_below_half = (df[‘MinMax’] < 0.5).sum() / len(df) * 100 print(f“\nResult: {data_below_half:.1f}% of data compressed below 0.5”) |
Output:
|
=== MinMaxScaler Analysis === Scaling range: 1.4 to 210.0 50% of data falls below: 0.199 75% of data falls below: 0.262 90% of data falls below: 0.319 95% of data falls below: 0.368 99% of data falls below: 0.541
Result: 98.6% of data compressed below 0.5 |
What’s happening: When outliers push the maximum to 210 while most data sits around 20-80, the denominator becomes huge. The formula (value – min) / (max – min) compresses normal values into a tiny fraction of the [0,1] range.
Effect of Standard Scaler on Sample Data
Next, let’s see how StandardScaler’s dependence on mean and standard deviation gets thrown off by outliers, affecting the scaling of perfectly normal data points.
|
1 2 3 4 5 6 7 8 9 10 11 12 13 14 15 16 17 18 19 20 |
print(“\n=== StandardScaler Analysis ===”) mean_orig = df[‘original’].mean() std_orig = df[‘original’].std()
# Compare with/without outliers clean_data = df[‘original’][df[‘original’] < 150] mean_clean = clean_data.mean() std_clean = clean_data.std()
print(f“With outliers: mean={mean_orig:.2f}, std={std_orig:.2f}”) print(f“Without outliers: mean={mean_clean:.2f}, std={std_clean:.2f}”) print(f“Outlier impact: mean +{mean_orig – mean_clean:.2f}, std +{std_orig – std_clean:.2f}”)
# Show impact on typical data points typical_value = 50 z_with_outliers = (typical_value – mean_orig) / std_orig z_without_outliers = (typical_value – mean_clean) / std_clean print(f“\nZ-score for value 50:”) print(f“With outliers: {z_with_outliers:.2f}”) print(f“Without outliers: {z_without_outliers:.2f}”) |
Output:
|
=== StandardScaler Analysis === With outliers: mean=45.65, std=20.52 Without outliers: mean=45.11, std=18.51 Outlier impact: mean +0.54, std +2.01
Z–score for value 50: With outliers: 0.21 Without outliers: 0.26 |
What’s happening: Outliers inflate both the mean and standard deviation. Normal data points get distorted z-scores that misrepresent their actual position in the distribution.
Effect of Robust Scaler on Sample Data
Finally, let’s demonstrate why RobustScaler’s use of the median and IQR makes it resistant to outliers. This provides consistent scaling regardless of extreme values.
|
1 2 3 4 5 6 7 8 9 10 11 12 13 14 15 16 17 18 19 20 21 22 |
print(“\n=== RobustScaler Analysis ===”) median_orig = df[‘original’].median() q25, q75 = df[‘original’].quantile([0.25, 0.75]) iqr = q75 – q25
# Compare with/without outliers clean_data = df[‘original’][df[‘original’] < 150] median_clean = clean_data.median() q25_clean, q75_clean = clean_data.quantile([0.25, 0.75]) iqr_clean = q75_clean – q25_clean
print(f“With outliers: median={median_orig:.2f}, IQR={iqr:.2f}”) print(f“Without outliers: median={median_clean:.2f}, IQR={iqr_clean:.2f}”) print(f“Outlier impact: median {abs(median_orig – median_clean):.2f}, IQR {abs(iqr – iqr_clean):.2f}”)
# Show consistency for typical data points typical_value = 50 robust_with_outliers = (typical_value – median_orig) / iqr robust_without_outliers = (typical_value – median_clean) / iqr_clean print(f“\nRobust score for value 50:”) print(f“With outliers: {robust_with_outliers:.2f}”) print(f“Without outliers: {robust_without_outliers:.2f}”) |
Output:
|
=== RobustScaler Analysis === With outliers: median=42.81, IQR=25.31 Without outliers: median=42.80, IQR=25.08 Outlier impact: median 0.01, IQR 0.24
Robust score for value 50: With outliers: 0.28 Without outliers: 0.29 |
What’s happening: The median and IQR are calculated from the middle 50% of data, so they remain stable even with extreme outliers. Normal data points get consistent scaled values.
When to Use Which Scaler
Based on the understanding of how the different scalers work and their effect on a skewed dataset, here’s a practical decision framework I suggest:
Use MinMaxScaler when:
- Your data has a known, meaningful range (e.g., percentages, ratings)
- You need bounded output for neural networks with specific activation functions
- No significant outliers are present in your dataset
- You’re doing image processing where pixel values have natural bounds
Use StandardScaler when:
- Your data is approximately normally distributed
- You’re using algorithms that work well on data with zero mean and unit variance
- No significant outliers are corrupting mean/std deviation calculations
- You want easy interpretation (values represent standard deviations from the mean)
Use RobustScaler when:
- Your data contains outliers that you can’t or shouldn’t remove
- Your data is skewed but you want to preserve the distribution shape
- You’re in exploratory phases and unsure about data quality
- You’re working with financial, web analytics, or other real-world messy data
Which Scaler to Choose? Quick Decision Flowchart
Sometimes you need a quick programmatic way to choose the right scaler. This function analyzes your data’s characteristics and suggests the most appropriate scaling method:
|
1 2 3 4 5 6 7 8 9 10 11 12 13 14 15 16 17 18 19 20 21 22 23 24 25 26 27 |
def recommend_scaler(data): “”“ Simple scaler recommendation based on data characteristics ““” # Calculate key statistics skewness = abs(stats.skew(data)) q25, q75 = np.percentile(data, [25, 75]) iqr = q75 – q25 outlier_threshold = q75 + 1.5 * iqr outlier_pct = (data > outlier_threshold).sum() / len(data) * 100
print(f“Data analysis:”) print(f“Skewness: {skewness:.2f}”) print(f“Outliers: {outlier_pct:.1f}% of data”)
if outlier_pct > 5: return “RobustScaler – High outlier percentage” elif skewness > 1: return “RobustScaler – Highly skewed distribution” elif skewness < 0.5 and outlier_pct < 1: return “StandardScaler – Nearly normal distribution” else: return “RobustScaler – Default safe choice”
# Test on our messy data recommendation = recommend_scaler(df[‘original’]) print(f“\nRecommendation: {recommendation}”) |
As expected, RobustScaler works well on our sample dataset.
|
Data analysis: Skewness: 2.07 Outliers: 2.0% of data
Recommendation: RobustScaler – Highly skewed distribution |
Here’s a simple flowchart to help you decide:

Image by Author | diagrams.net (draw.io)
Conclusion
MinMaxScaler works great when you have clean data with natural boundaries. StandardScaler works well with normally distributed features but isn’t as effective when outliers are present.
For most real-world datasets with skew and outliers, RobustScaler is your safest bet when working with messy and skewed real-world data.
The best scaler is the one that preserves the meaningful patterns in your data while making them accessible to your chosen algorithm. There are many more scalers whose implementations you can find in scikit-learn for preprocessing skewed datasets.