![Average engagement rates for 12 industries [2026 update]](https://mgrowtech.com/wp-content/uploads/2026/06/Average-engagement-rate-media-benchmarks-Q4-2024-data-tips-time-to-post-on-social-media-Q3-2024-data.png)
Without social media benchmarks, it’s difficult to make sense of raw data. That’s why we’ve rounded up average social media engagement rates from 12 top industries to give you a better understanding of where you stand.
We’ve even included a simple (and free!) engagement rate calculator you can use to quickly double-check your own performance stats.
Key takeaways
- A “good” engagement rate is between 1 and 5%, but context is everything. What’s strong in one industry is average in another.
- Instagram is the best platform for engagement across most industries. It offers an average engagement rate of 3.5%.
- You can calculate your engagement rate manually, or skip the math with a tool like Hootsuite. It also surfaces industry benchmarks so you can see how you stack up.
Engagement rates vary widely by platform, with Instagram leading the pack and Facebook trailing behind. Here’s a quick breakdown:
- Average Instagram engagement rate: 3.5%
- Average Instagram Reels engagement rate: 2.8%
- Average LinkedIn engagement rate: 3.4%
- Average X engagement rate: 1.8%
- Average TikTok engagement rate: 1.5%
- Average Facebook engagement rate: 1.3%
Rates also vary by industry, with construction, education, and nonprofits among the strongest performers.
Below, you’ll find the latest average engagement rates (per post), broken down by industry and social network.
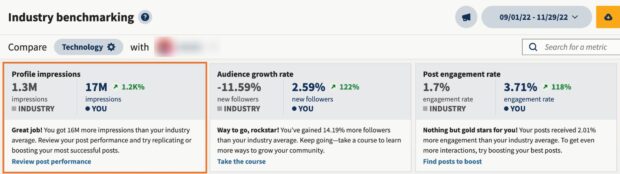
Pro tip 💡: For more benchmarks (impressions, audience growth rate, posting frequency, and more) — plus real-time insights to optimize your social media strategy — start a free 30-day Hootsuite trial and browse stats from your industry (and hand-picked competitors) in Hootsuite Analytics.
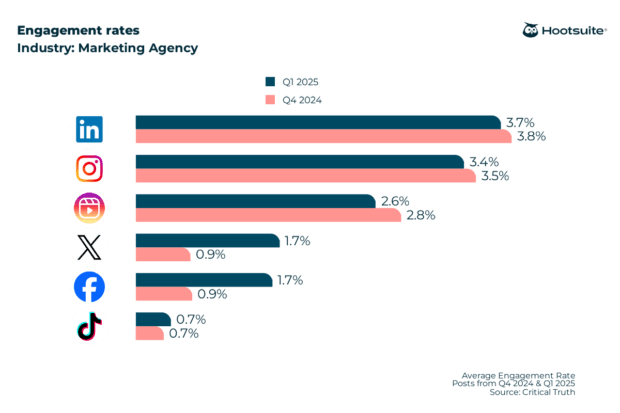
Marketing agencies
- Average LinkedIn engagement rate: 3.7%
- Average Instagram engagement rate: 3.4%
- Average Instagram Reels engagement rate: 2.6%
- Average X (Twitter) engagement rate: 1.7%
- Average Facebook engagement rate: 1.7%
- Average TikTok engagement rate: 0.7%
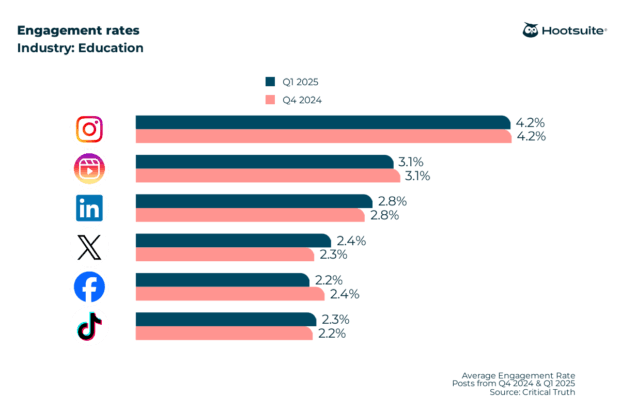
Education
- Average LinkedIn engagement rate: 2.8%
- Average Instagram engagement rate: 4.2%
- Average Instagram Reels engagement rate: 3.1%
- Average X (Twitter) engagement rate: 2.4%
- Average Facebook engagement rate: 2.2%
- Average TikTok engagement rate: 2.3%
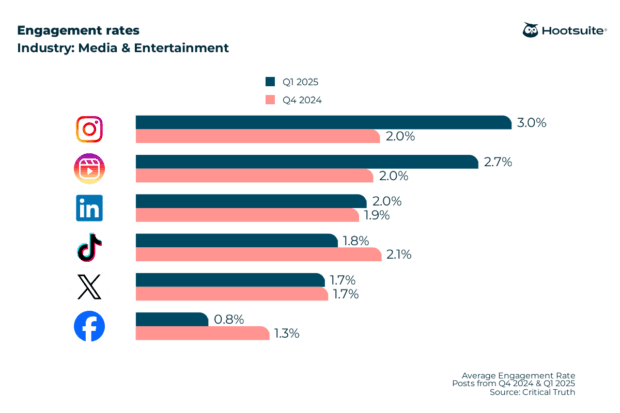
Media and Entertainment
- Average LinkedIn engagement rate: 2.0%
- Average Instagram engagement rate: 3.0%
- Average Instagram Reels engagement rate: 2.7%
- Average X (Twitter) engagement rate: 1.7%
- Average Facebook engagement rate: 0.8%
- Average TikTok engagement rate: 1.8%
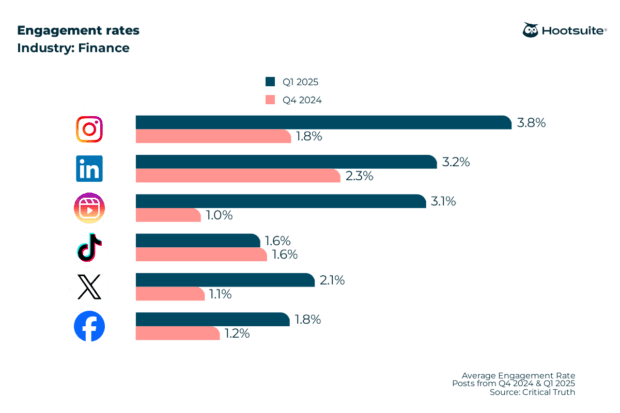
Financial services
- Average LinkedIn engagement rate: 3.2%
- Average Instagram engagement rate: 3.8%
- Average Instagram Reels engagement rate: 3.1%
- Average X (Twitter) engagement rate: 2.1%
- Average Facebook engagement rate: 1.8%
- Average TikTok engagement rate: 1.6%
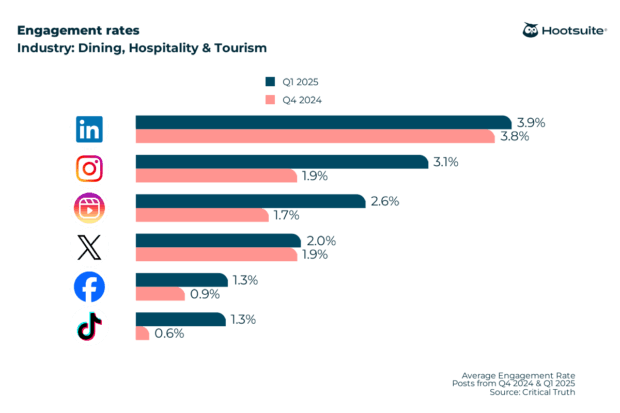
Dining, Hospitality, and Tourism
- Average LinkedIn engagement rate: 3.9%
- Average Instagram engagement rate: 3.1%
- Average Instagram Reels engagement rate: 2.6%
- Average X (Twitter) engagement rate: 2.0%
- Average Facebook engagement rate: 1.3%
- Average TikTok engagement rate: 1.3%
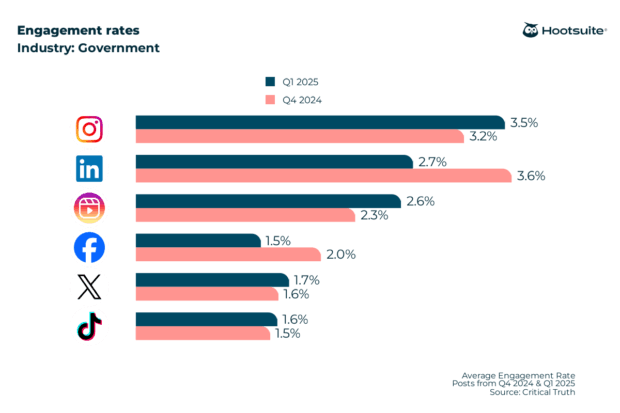
Government
- Average LinkedIn engagement rate: 2.7%
- Average Instagram engagement rate: 3.5%
- Average Instagram Reels engagement rate: 2.6%
- Average X (Twitter) engagement rate: 1.7%
- Average Facebook engagement rate: 1.5%
- Average TikTok engagement rate: 1.6%
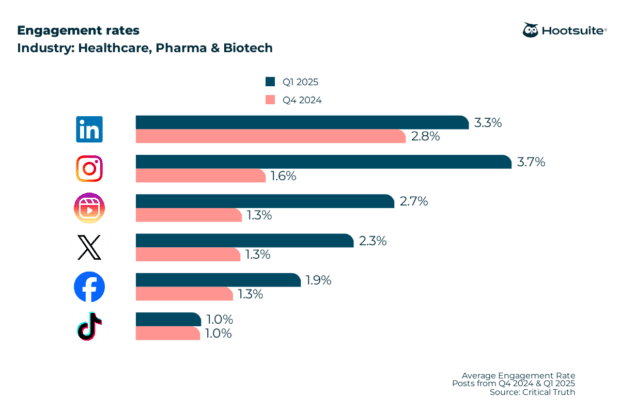
Healthcare, Pharma and Biotech
- Average LinkedIn engagement rate: 3.3%
- Average Instagram engagement rate: 3.7%
- Average Instagram Reels engagement rate: 2.7%
- Average X (Twitter) engagement rate: 2.3%
- Average Facebook engagement rate: 1.9%
- Average TikTok engagement rate: 1.0%
See more social media analytics in healthcare.
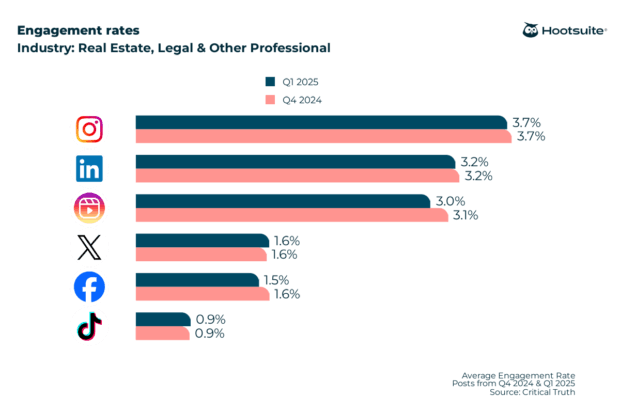
Real Estate, Legal and Other Professional
- Average LinkedIn engagement rate: 3.2%
- Average Instagram engagement rate: 3.7%
- Average Instagram Reels engagement rate: 3.0%
- Average X (Twitter) engagement rate: 1.6%
- Average Facebook engagement rate: 1.5%
- Average TikTok engagement rate: 0.9%
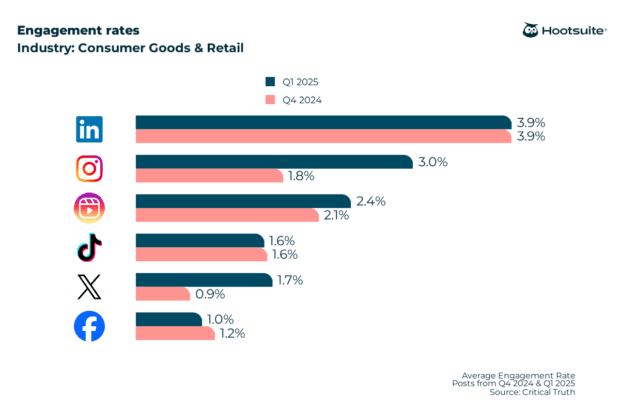
Consumer Goods & Retail
- Average LinkedIn engagement rate: 3.9%
- Average Instagram engagement rate: 3.0%
- Average Instagram Reels engagement rate: 2.4%
- Average X (Twitter) engagement rate: 1.7%
- Average Facebook engagement rate: 1.0%
- Average TikTok engagement rate: 1.6%
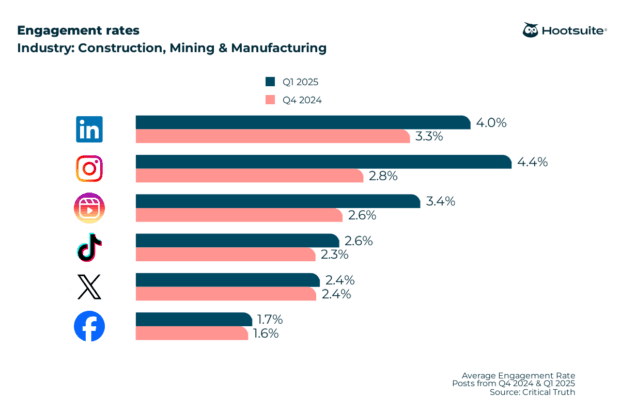
Construction, Mining and Manufacturing
- Average LinkedIn engagement rate: 4.0%
- Average Instagram engagement rate: 4.4%
- Average Instagram Reels engagement rate: 3.4%
- Average X (Twitter) engagement rate: 2.4%
- Average Facebook engagement rate: 1.7%
- Average TikTok engagement rate: 2.6%
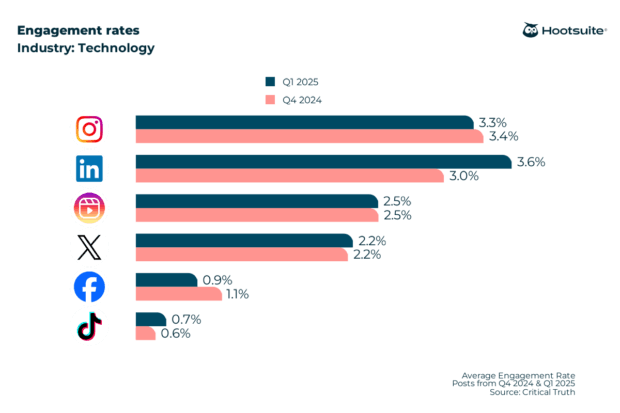
Technology
- Average LinkedIn engagement rate: 3.6%
- Average Instagram engagement rate: 3.3%
- Average Instagram Reels engagement rate: 2.5%
- Average X (Twitter) engagement rate: 2.2%
- Average Facebook engagement rate: 0.9%
- Average TikTok engagement rate: 0.7%
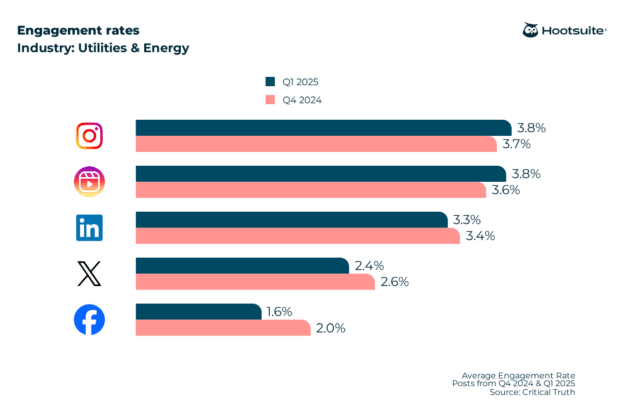
Utilities and Energy
- Average LinkedIn engagement rate: 3.3%
- Average Instagram engagement rate: 3.8%
- Average Instagram Reels engagement rate: 3.8%
- Average X (Twitter) engagement rate: 2.4%
- Average Facebook engagement rate: 1.6%
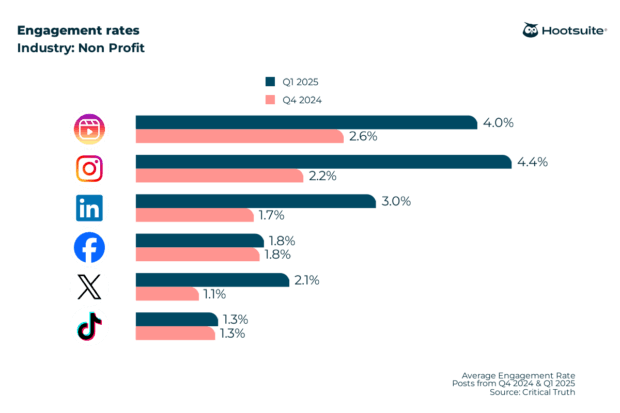
NonProfit
- Average LinkedIn engagement rate: 3.0%
- Average Instagram engagement rate: 4.4%
- Average Instagram Reels engagement rate: 4.0%
- Average X (Twitter) engagement rate: 2.1%
- Average Facebook engagement rate: 1.8%
- Average TikTok engagement rate: 1.3%
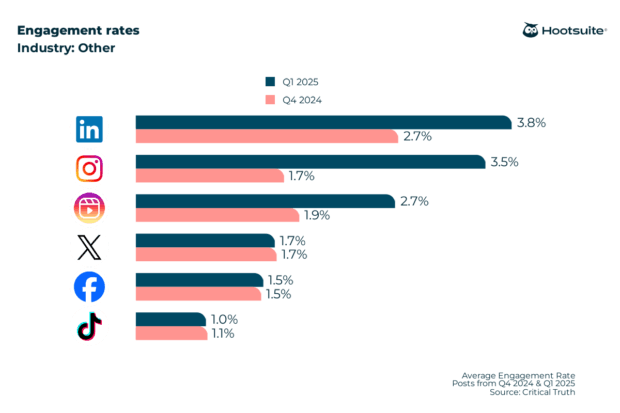
Other
- Average LinkedIn engagement rate: 3.8%
- Average Instagram engagement rate: 3.5%
- Average Instagram Reels engagement rate: 2.7%
- Average X (Twitter) engagement rate: 1.7%
- Average Facebook engagement rate: 1.5%
- Average TikTok engagement rate: 1.0%
Overall
- Average Instagram engagement rate: 3.5%
- Average Facebook engagement rate: 1.3%
- Average X (Twitter) engagement rate: 1.8%
- Average LinkedIn engagement rate: 3.4%
- Average TikTok engagement rate: 1.5%
- Average Instagram Reel engagement rate: 2.8%
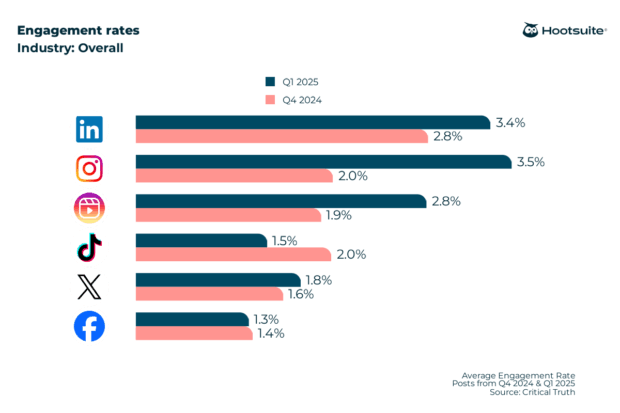
Instagram is the best platform for engagement. It consistently records the highest average engagement rates across all industries at 3.5% overall, according to our research.
For brands and organizations just getting started with social media marketing, Instagram’s visual appeal, interactive features, and smart algorithm give engagement a natural boost.
Curious how your Instagram posts are really performing? Use this Instagram Engagement Rate Calculator to measure likes, comments, and shares and see how you stack up.
Average engagement rates: Key insights
1. Nonprofits top Instagram Reels engagement
Nonprofits lead the pack in terms of engagement on Instagram Reels (4.0%). Turns out, content with a real mission behind it tends to strike an emotional chord, which is exactly what Reels rewards.
2. TikTok remains a challenge for many industries
Despite its popularity, TikTok had the lowest overall average engagement rate at 1.5%, with some industries, like Marketing Agencies and Technology, recording rates below 1%.
3. Consumer Goods & Retail excels on LinkedIn
The Consumer Goods & Retail sector shows consistently high engagement rates across most major social platforms, particularly on LinkedIn at 3.9%. This strong performance may be due to its informative and discussion-driven posts.
Free engagement rate calculator
Ready to compare your performance to industry benchmarks? Use this free tool to find out your engagement rate by post.
Note: If you’re calculating your account’s total engagement, include information about all your posts (e.g., total number of posts published, total number of likes, total number of impressions, and so on).
If you’re calculating the engagement rate of a specific social media marketing campaign, only include the details of the social media posts that were part of the campaign.
[engagement_rate_calculator]
If you’re looking for more detailed data or you want to calculate different kinds of engagement (like engagement rate by reach or engagement rate by impressions), download our free spreadsheet calculator that will do the math for you.
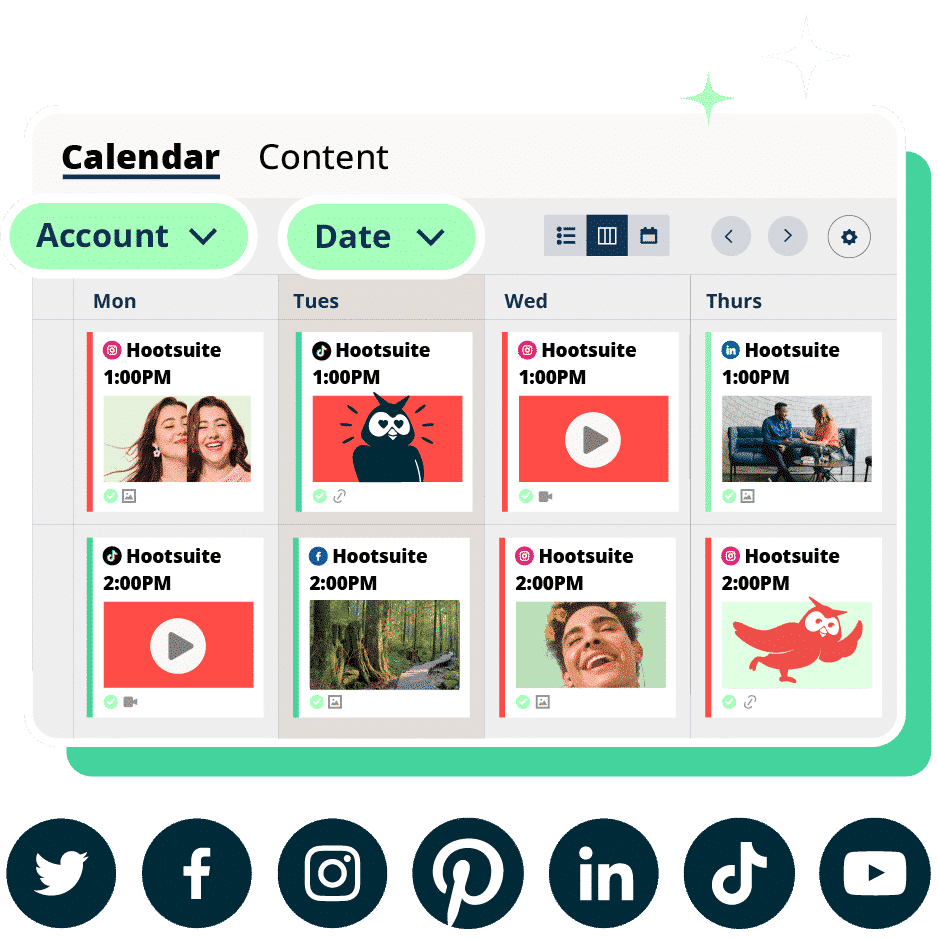
Or, better yet, start a free 30-day Hootsuite trial to easily track the performance of all your social channels in one place. Hootsuite’s social media analytics tool collects your stats from Facebook, Instagram, Twitter, LinkedIn, and TikTok.
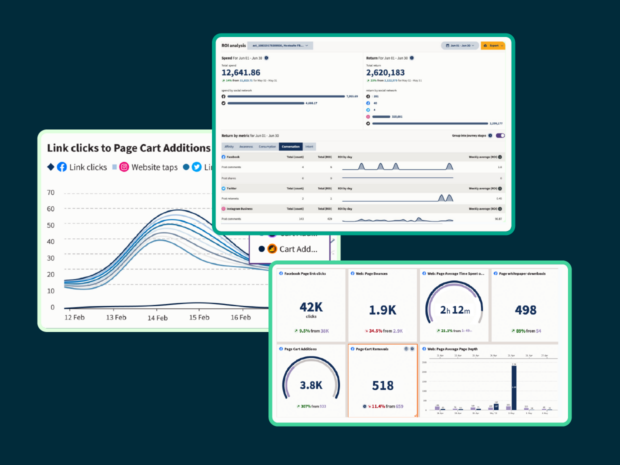
With Hootsuite Analytics, you can also:
- Find out when your audience is online
- Get personalized recommendations for your best times to post for each of your accounts
- View industry benchmarks and see how you compare to competitors
FAQ: Average engagement rates
What is a good engagement rate on social media?
A good engagement rate generally falls between 1% and 5%, depending on your industry and platform. An engagement rate above 3% is strong on Instagram and LinkedIn, while 1 to 2% is closer to the norm on Facebook and TikTok.
How is average engagement rate calculated across platforms?
What factors impact average engagement rate for brands?
How do engagement rate benchmarks vary by industry and platform?
Engagement rates vary widely by both industry and platform. Construction, education, and nonprofits see the highest engagement rates on average. Platform-wise, Instagram and LinkedIn offer a higher engagement rate (around 3.5% and 3.4% overall) than Facebook and TikTok (around 1.3% and 1.5%).
Average engagement rate vs reach: which metric matters more?
It depends on your goal. Engagement rate is one of the most important metrics for content quality, while reach matters more when your goal is awareness and getting in front of new people. Tracking both helps you spot low engagement early and improve content performance.
How can brands improve their engagement rate?
Brands improve their engagement rate by creating high-quality content their target audience actually cares about, then doubling down on what works. Review your engagement data to see which content types are performing, boost top-performing posts with paid promotion, add hashtags to make content more discoverable, and routinely adjust your content strategy based on what the numbers tell you.
Bring your social media strategy together in Hootsuite. Publish posts, track engagement rates, and benchmark your social media performance, all from one dashboard. Try it free today.