
How to Interpret Your XGBoost Model: A Practical Guide to Feature Importance
Image by Editor | ChatGPT
Introduction
One of the most widespread machine learning techniques is XGBoost (Extreme Gradient Boosting). An XGBoost model — or an ensemble that combines multiple models into a single predictive task, to be more precise — builds several decision trees and sequentially combines them, so that the overall prediction is progressively improved by correcting the errors made by previous trees in the pipeline.
Just like standalone decision trees, XGBoost can accommodate both regression and classification tasks. While the combination of many trees into a single composite model may obscure its interpretability at first, there are still mechanisms to help you interpret an XGBoost model. In other words, you can understand why predictions are made and how input features contributed to them.
This article takes a practical dive into XGBoost model interpretability, with a particular focus on feature importance.
Understanding Feature Importance in XGBoost
A central concept in machine learning model interpretability, feature importance refers to the level of significance or influence each input feature of a data instance (or observation) has on a model’s prediction. Understanding how — and to what extent — each predictor feature like the location of a house, its age, or its size influences a target predicted value like the house price is fundamental not only to better comprehend how moderately complex machine learning models like XGBoost make decisions, but also to enhance their performance by focusing on the most relevant features or sometimes discarding the least influential ones.
A Practical Example
To witness the importance of feature importance in action, let’s consider the following practical example in which we will train and test an XGBoost regressor to estimate the price of houses in California districts, based on the freely available version of the California Housing dataset in Scikit-learn’s datasets module.
Importing Modules, Loading & Splitting Data
Here we import the modules, load the data, split it into training (90%) and test (10%) sets:
|
import xgboost as xgb import pandas as pd import numpy as np from sklearn.datasets import fetch_california_housing from sklearn.model_selection import train_test_split from sklearn.metrics import mean_squared_error
# Load the data data = fetch_california_housing() X = pd.DataFrame(data.data, columns=data.feature_names) y = data.target
# Split the data X_train, X_test, y_train, y_test = train_test_split(X, y, test_size=0.1, random_state=42) |
Initializing the XGBoost Ensemble Model
Now it’s time to initialize the ensemble model, with manually set hyperparameters like the number of trees and maximum depth per tree, after which we will train and evaluate its error (RMSE) on the test data:
|
# Build the model model = xgb.XGBRegressor( n_estimators=400, max_depth=8, learning_rate=0.05, subsample=0.8, random_state=42 )
# Train the model model.fit(X_train, y_train)
# Test the model y_pred = model.predict(X_test) print(“Test RMSE:”, np.sqrt(mean_squared_error(y_test, y_pred))) |
For simplicity, the example above omitted preprocessing steps like scaling numerical features, although in practice this is often recommended to enhance model performance.
If you are familiar with building machine learning models with Scikit-learn, you may have noticed something different: the XGBRegressor class belongs to its own dedicated library, xgboost (imported here as xgb), instead of being an internal class in Scikit-learn. While this dedicated library offers specific support for aspects like feature importance, as we are about to see, it also incorporates a Scikit-learn-like API that enables the use of common methods like fit() and predict() seamlessly.
Analyzing Feature Importance
So, how do you obtain and analyze the feature importance of your newly built XGBoost solution? The simplest approach is to create a bar plot that displays the importance of input features in the dataset, as follows:
|
import matplotlib.pyplot as plt
xgb.plot_importance(model, importance_type=‘gain’, height=0.4) plt.title(‘Feature Importance (Gain)’) plt.show() |
And here is the result:

Feature importance bar plot
Image by Author
At first glance, it may seem that the MedInc (median income) attribute is by far the most influential feature for predicting house prices in a district, followed by AveOccup (average occupancy), and the geographical location of the district (longitude and latitude). Meanwhile, other attributes like the average number of bedrooms are deemed less important in predicting house prices in a district. But before taking these hypotheses for granted, let’s look more carefully at what we just did.
The plot_importance method automatically uses the features from the trained XGBoost regressor. A key setting for this method is the importance_type argument. This argument allows you to display different importance types, with 'gain' being one of them. Gain stands for the average improvement in model performance (or loss reduction) when a certain feature is used as part of a tree in an ensemble. More specifically, we are referring to the improvement when that feature is used to split the data in a tree. Thus, the right way to interpret the above feature importance plot is that longer bars (higher gain) are associated with features that contributed the most to reducing prediction error.
Gain is just one of several dimensions in which feature importance can be measured; the other two are 'weight' and 'cover':
- Weight (
'weight'): This indicates the number of times a feature has been used in a split of a tree within the XGBoost ensemble, therefore being a more “direct” and frequency-based indicator of the feature’s influence and contribution to the final prediction. - Coverage (
'cover'): This is the average number of samples (training instances) affected by splits that use a specific feature. For instance, if split nodes related to the median income attribute generally contain a large number of instances, the coverage of that feature tends to be higher.
By visualizing these two additional “views” of feature importance, we can better understand different nuances of the way our ensemble works:
|
fig, axes = plt.subplots(1, 2, figsize=(14, 6))
xgb.plot_importance(model, importance_type=‘weight’, height=0.4, ax=axes[0], color=‘green’) axes[0].set_title(‘Feature Importance (Weight)’)
xgb.plot_importance(model, importance_type=‘cover’, height=0.4, ax=axes[1], color=‘orange’) axes[1].set_title(‘Feature Importance (Cover)’)
plt.tight_layout() plt.show() |
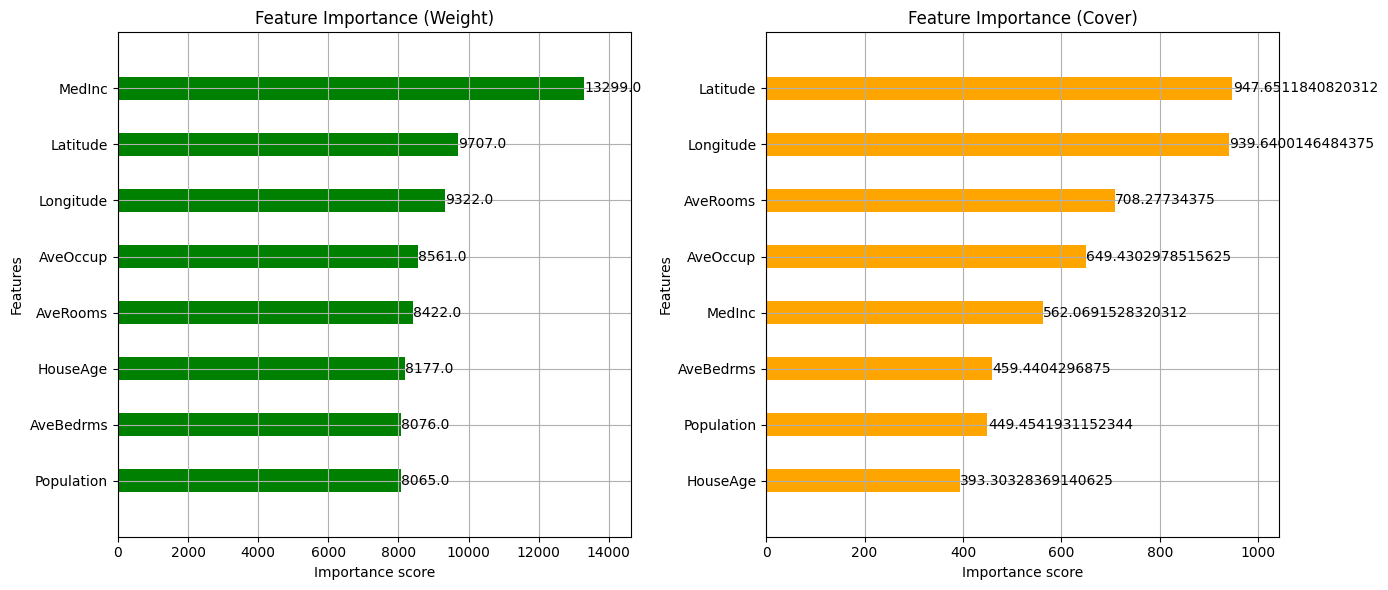
Feature importance based on weights and coverage
Image by Author
Some key insights to observe include the following:
- If we compare the three plots, we can see that, depending on the angle from which we observe feature importance (gain vs. weight vs. coverage), the ranking of attributes by importance may vary. Take the two geographical features (latitude and longitude), for instance: while in terms of contribution to performance gain, they lie behind the average occupancy feature, from a weight perspective, these attributes are more influential in the actual predictions, as they are used more often in splits throughout the ensemble.
- Some attributes’ importance may vary greatly depending on the specific aspects we are analyzing. A clear example of this is the median income feature, which is the most important from a gain and weight vantage point but becomes significantly less important in terms of coverage. In other words, while this attribute contributes the most to improving model performance and is used in more splits than any other attribute, the splits using it tend to contain fewer instances. This suggests that the
MedIncfeature is frequently used in splits that positively contribute to performance, but these splits cover smaller portions of the data, arguably because they are located in deeper or narrower parts of the tree rather than in shallower splits near the top, which affect many instances.
Wrapping Up
XGBoost is a versatile machine learning technique. Besides its ability to accommodate predictive problems with moderately complex datasets, one of its distinctive features is the set of mechanisms to analyze its interpretability — that is: how decisions (predictions) are made, and more importantly, how the different input data features contribute not only to the predictions, but also to the model’s performance.
This article presented a practical exploration of XGBoost model interpretability by providing a deeper understanding of feature importance.