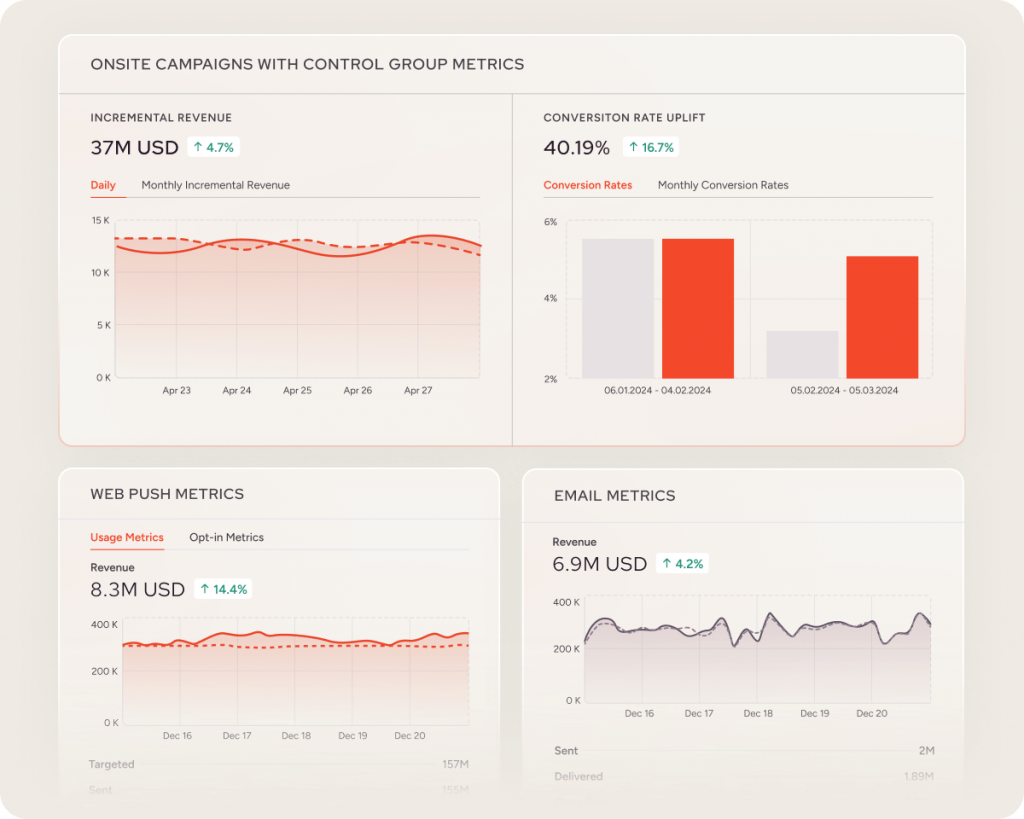
Your analytics dashboard shows 2.4 million sessions last month.
Email open rates are holding at 22%.
App installs are up 18%.
And yet, revenue is flat, repeat purchase rates are slipping, and your highest-value customers are quietly buying elsewhere.
More data has not produced more clarity.
That is the central problem with how most brands approach customer engagement analytics in 2026.
They’ve invested heavily in collection and almost nothing in activation. The result is dashboards that describe the past and strategies that react to it, weeks too late.
The brands pulling ahead aren’t working with better data. They’re working with the same behavioral signals, but they’ve built the systems and habits to act on them before the opportunity closes.
This guide covers what customer engagement analytics actually means in 2026, which metrics are worth tracking and how to build a data collection architecture that doesn’t collapse into silos.
Let’s get started.
What is customer engagement analytics?
Customer engagement analytics involves measuring and interpreting data from every brand interaction (websites, social media, mobile apps, and support channels) to decode customer behavior. It functions as the predictive layer of an ecommerce stack, identifying which customers are primed for a second purchase and which are silently disengaging.
At Insider One, we treat this as the brand’s central nervous system. This process moves beyond surface-level tracking by synthesizing behavioral signals into actionable triggers through Insider One’s Actionable CDP and journey orchestration, powered by Sirius AI™.
The platform combines four layers working in sequence: the Actionable CDP unifies data from every source into a single customer profile; Architect orchestrates real-time journeys across channels; Sirius AI™ applies predictive intelligence to determine the next best action; and Agent One™ executes those actions autonomously without manual campaign setup.
A customer who views a specific product category four times in two weeks and saves two items to a wishlist provides a clear signal of intent. Without a unified system, a marketing team sees only a passive browser. With it, they identify a high-intent buyer requiring a single relevant interaction to complete a transaction.
This approach reveals the logic behind customer actions.
For example, a mid-size apparel brand monitored a segment of subscribers who frequently added items to their carts but stopped at the shipping selection.
Standard behavioral data classified them as engaged users.
Engagement analytics isolated the exact friction point. The team deployed a targeted free-shipping offer only for that segment, resulting in a 34% conversion increase within 30 days. This targeted application of data preserved profit margins that a sitewide promotion would have eroded.
Here are two additional examples:
- PUMA: Increased conversion rates by 27% using Insider’s Social Proof and onsite banner campaigns to personalize experiences based on customer engagement. Here is the case study.
- Lenovo: Utilized Insider to analyze user behavior, resulting in a 13.91% uplift in conversion from personalized coupons and a 22.08% increase in average session duration. Here is the case study.
Why customer engagement analytics matter in 2026
The reliance on lagging indicators is a primary cause of stagnant growth.
Most ecommerce teams wait for repeat purchase reports to show who stopped buying last quarter or review return volumes to understand what went wrong last month. These metrics provide a historical record of failure rather than a roadmap for growth.
By the time these signals reach a team, the window for retention has closed.
Customer engagement analytics provides a lead time that changes the financial outcome of a customer relationship. This system identifies a customer whose browse frequency doubled this week but who failed to add items to their cart.
This allows for a personalized recommendation before that customer migrates to a competitor.
Success requires a system like Architect, Insider One’s journey orchestration capability, does exactly that, and Sirius AI™ determines what that response should be. For example: when Sirius AI™ detects a 40% drop in a high-value customer’s engagement score, it automatically calculates the optimal offer, selects the highest-response channel for that individual, and schedules delivery at their peak engagement window, without a manual campaign trigger.
- Predictive retention: High-value customers receive targeted offers via Predictive AI the moment their interaction frequency drops by 40%, preventing the lapse before it becomes permanent.
- Friction elimination: Real-time monitoring captures where a customer struggles with navigation or checkout, allowing for an immediate fix rather than a post-mortem analysis.
- Margin protection: Incentives are restricted to segments showing specific exit signals, ensuring that discounts recover revenue rather than erode existing profit.
- Behavioral personalization: Campaigns rely on current intent signals (like recent category deep-dives) rather than outdated seasonal assumptions or broad demographics.
The customer engagement metrics that actually matter
Most engagement analytics programs fail because they track too many data points with no clear ownership. When every number receives equal attention, the data ceases to drive decisions.
A functional program requires a tight set of signals organized around the current state of the customer relationship.
The following categories group metrics by their ability to predict behavior and revenue outcomes.
Prioritizing these signals allows teams to identify where the purchase journey breaks down and which segments require immediate intervention.
Health and loyalty
- Customer engagement score (CES) combines signals like site visit frequency, email click activity, wishlist additions, purchase recency, and loyalty program interactions into a single composite score per customer. Weigh each signal based on its historical correlation with repeat purchase rate. A rising CES is a leading indicator that retention will follow. A declining one gives you time to intervene before lapse becomes permanent.
- Net promoter score (NPS) measures how likely a customer is to recommend your brand, on a 0-10 scale. A score above 50 is strong. Above 70 is world-class. The verbatim responses from detractors are more actionable than the number itself. They name the exact friction point, whether shipping speed, product quality, or return experience.
- Customer satisfaction score (CSAT) captures how a customer felt about a specific interaction, a delivery, a return, a support conversation. A consistently low CSAT at a particular touchpoint tells you that moment is actively damaging the broader relationship, regardless of how healthy your other metrics look.
- Customer effort score measures how much work a customer had to do to complete a task, whether finding a product, checking out, processing a return. High effort at any point in the purchase journey correlates directly with lapse.
Retention and revenue
- Repeat purchase rate measures the percentage of customers who made more than one purchase within a given period. For most ecommerce categories, above 25-30% within the first 90 days indicates strong early retention. Break it down by acquisition channel and first-purchase category to identify which entry points produce the most durable customers.
- Customer lifetime value (CLV) projects total revenue a customer is expected to generate across their full relationship with your brand. A healthy CLV runs at 3-5x your customer acquisition cost. Track it quarterly by acquisition cohort. A declining trend is one of the clearest signals that something in acquisition or early retention has degraded.
- Average order value (AOV) tracks average revenue per transaction. A customer with a lower AOV who buys six times a year is frequently more valuable than one with a high AOV who buys once. Segment by customer tier and category to identify where cross-sell and upsell opportunities are being missed.
- Retention rate by cohort shows what percentage of customers acquired in a specific period are still purchasing at the 30, 60, 90, and 180-day marks. Cohort-level analysis surfaces exactly where in the lifecycle the relationship breaks down, the only way to fix the right thing.
Shopping behavior
- Cart abandonment rate measures the percentage of customers who added to cart but didn’t complete the purchase. Industry average sits around 70%. Consistently above that signals a specific friction point, shipping cost surprise, forced account creation, or a payment method gap. Segment by device, traffic source, and cart value to isolate where drop-off concentrates.
- Browse-to-purchase rate tracks the percentage of product page views that result in a purchase. A low rate in a specific category usually signals a content gap, a pricing issue, or a missing trust signal. A low rate across all categories points to a broader site experience problem.
- Purchase frequency measures how often a customer buys within a given period. Customers who bought across two different categories in their first 90 days typically show significantly higher long-term purchase frequency than single-category buyers, a pattern worth building acquisition and onboarding strategy around.
- Engagement recency records the days since a customer’s last meaningful interaction, a site visit, email click, purchase, or loyalty check-in. Recency moves before every other warning signal does, before NPS drops, before support contacts spike, and before the customer actively decides to stop buying from you.
Campaign and channel
- Click-through rate (CTR) measures the percentage of customers who clicked a link in your campaigns. A low CTR on a high-open-rate email means the offer or CTA failed. A low CTR on a low-open-rate email means the subject line failed. Separating those two diagnoses prevents teams from applying the wrong fix.
- Conversion rate tracks how many customers completed a desired action. Measure at the segment level. A 30% uplift among your lapsed segment carries more strategic weight than a 5% improvement across your entire base.
- Channel response rate measures how customers engage across email, SMS, push, and in-app messaging. This tells you where each segment actually wants to hear from you.
Which metrics to prioritize first
If you are building an engagement analytics program from scratch, start with four:
- Engagement recency because it catches lapsing customers before the relationship is gone.
- Repeat purchase by cohort tells you whether your retention model is structurally sound or broken at a specific lifecycle stage
- Cart abandonment identifies the most immediate revenue recovery opportunity on your site.
- CLV keeps every decision anchored to long-term revenue impact rather than short-term campaign performance.
Add the remaining metrics as your program matures and your team has the capacity to act using Insider One’s real-time reporting and analytics.
Brands that start with these four metrics typically see measurable improvements in segment-specific conversion and churn reduction within 60–90 days. Full ROI, including savings from consolidating multiple point solutions, generally materialises within 6–12 months.
How to collect customer engagement data without creating new silos
Most ecommerce teams collect engagement data in separate systems that never communicate, then spend months wondering why they can’t get a complete picture of customer behavior.
The systems work individually and the architecture fails collectively.
Effective engagement data collection operates across four layers, and all four need to feed into a single unified customer profile to be useful.
- On-site and in-app behavioral data. Your site and app generate the richest intent signals you have access to. Track clicks, navigation paths, session depth, and the sequence of actions that precede a purchase versus an abandonment. The pattern matters more than any individual event.
- Cross-channel messaging data. Knowing which channels your customers actually respond to is what separates relevant outreach from ignored noise. Email clicks, push responses, SMS interaction rates, and in-app message dismissals tell you exactly that. Evaluate messaging data in context of what the customer did next, not as a standalone performance metric.
- Voice of customer data. Behavioral data tells you what customers did. It rarely tells you why. NPS surveys, CSAT responses, post-purchase feedback, and cancellation surveys fill that gap. Trigger them at critical moments like after a first purchase, after a support interaction, at the 90-day mark. The verbatim responses are consistently more actionable than the numeric score.
- CRM and external system data. Not all inactive customers carry the same risk. Purchase history, loyalty tier, support ticket volume, and offline transactions give you the context to tell them apart. A customer who has spent $15,000 with you but hasn’t visited in 45 days is a very different risk profile than one with the same inactivity who has spent $150. Treating them identically is how high-value relationships quietly break.
| Pro-tip: Before any of this data becomes useful, it needs to live in one place. Insider One’s Actionable CDP connects to 100+ data sources, from Shopify and Salesforce to Google Ads, Zendesk, and offline transaction systems, stitching together behavioral data, transaction history, support interactions, and campaign responses into unified profiles that every team can act on simultaneously. No manual exports, no reconciliation lag. Most CDP implementations require ongoing professional services to maintain connections as source systems update. Insider One’s native integrations are maintained at the platform level, which means connector upkeep doesn’t fall to your internal team and data freshness doesn’t degrade as your stack evolves. |
Compliance by design
A note on compliance by design: collecting behavioral data at scale requires consent management built into the architecture, not bolted on after the fact. Insider One’s Actionable CDP is designed around first-party data signals and supports configurable consent frameworks aligned with GDPR, CCPA, and regional equivalents — so data collection and regulatory compliance operate from the same foundation rather than in tension.
3 ways to use analytics to improve customer engagement right now
These three practices will help you improve your customer engagement:
1. Segment by purchase behavior and build differentiated communication tracks
A customer who bought across two categories in their first 30 days might have completely different needs than one who made a single purchase and went quiet.
Treating both with the same post-purchase email sequence can produce predictably average results.
So it’s best to segment your base into five tiers:
- Highly active
- Regularly engaged
- Occasionally active
- At-risk
- Lapsed
Build genuinely differentiated tracks for each.
For example, highly active customers get early access to new arrivals and category launches before they hit the broader list. And occasionally active customers get campaigns that surface products relevant to their browsing history.
At-risk customers get friction-removal messaging based on where they last dropped off, whether that’s cart abandonment, a shipping concern, or an unresolved return.
Brands that execute this can drive measurable retention improvements within 60-90 days. The same model applies beyond apparel. A subscription meal-kit brand using this segmentation approach identified subscribers whose order-skip rate had doubled in 30 days, a leading indicator of cancellation invisible to standard churn reports. Targeted reactivation messaging to the at-risk tier reduced lapse by 22% within the first cohort, without discounting to segments that would have renewed, regardless.
2. Combine funnel analysis with behavioral session data to eliminate checkout friction
Aggregate conversion metrics tell you where drop-off happens. And session replay tells you why.
Used separately, both are limited. Combined, they produce the shortest path from symptom to fix.
If your funnel analysis shows 60% of customers abandoning between the cart and payment stage, that’s a signal worth investigating.
Insider One’s behavioral data surfaces exactly what customers did at that drop-off point, the navigation paths, the hesitation patterns, the repeated field interactions, revealing whether the cause is a shipping cost surprise, a required account creation step, a payment method gap, or a friction point on mobile. No third-party session tool required.
Once you’ve identified the cause, fix it, re-run the funnel, and measure the outcome. Teams that skip session replay end up fixing the symptom rather than the source, which is why the same drop-off reappears in the next reporting cycle.
3. Use behavioral data to build loyalty programs that reflect actual customer behavior
Traditional loyalty programs rely on spend thresholds, which only reflect historical transactions.
A customer who made a single high-value purchase two years ago appears identical to a frequent moderate-value shopper until behavioral data is applied.
However, effective loyalty structures prioritize current engagement over past spending.
By using engagement analytics, brands identify durable retention assets: customers who browse frequently, purchase across multiple categories, and maintain activity over 12 months.
This data allows for the creation of incentives that reflect actual behavior rather than arbitrary points.
- Behavior-based access: Granting early access to new collections based on browsing frequency ensures the most interested customers see products first.
- Pattern-matched rewards: Providing category-specific incentives tied to a customer’s specific purchase history prevents the waste of generic discounts.
- Predictive replenishment: Using actual consumption intervals to send personalized reminders for recurring purchases ensures the brand remains the default choice for consumables.
- Engagement-linked tiers: Rewarding non-transactional actions, such as referring others or interacting with app content, builds a relationship that extends beyond the checkout page.
Key metrics to track after implementation
Implementing a customer engagement analytics program requires real investment.
Proving that investment was sound means tracking outcome metrics that connect directly to revenue from the start.
- Conversion rate uplift measures whether your personalization and targeting are closing more of the actions that matter. Track at the segment level. A 30% uplift among your at-risk segment is more strategically significant than a 5% improvement across your entire base.
- Churn reduction is the most direct financial proof point. A 1.5% point reduction in monthly churn across a 50,000-customer base at $100 average revenue per customer represents $900,000 in annual revenue retained that would otherwise have left.
- CLV growth is the north star. Track it quarterly by acquisition cohort to determine whether customers you are bringing in now are on a better revenue trajectory than those acquired 12 months ago.
- Engagement score trend is your leading indicator. A rising average CES tells you relationship quality is improving before it shows up in revenue. A declining trend gives you time to intervene before retention metrics follow.
- Operational cost savings are real and often underreported. Consolidating data from 5-8 disparate tools reduces integration overhead, cuts the hours spent manually pulling data, and compresses the time between insight and campaign launch.
The cost of silent disengagement
Every behavioral signal your ecommerce customers generate is a data point about the health of that relationship. And every one that goes unread or unacted on is a decision made by default rather than by design.
The ecommerce brands growing fastest in 2026 have built the systems to close the loop between insight and action before the window closes.
That requires unified customer data, disciplined segmentation, and a team culture that treats a drop in engagement as something worth investigating rather than averaging away.
Most platforms solve one layer: a CDP, a campaign tool, or an AI engine. The gap between insight and action remains because those layers don’t share data in real time, don’t speak to each other, and require a team to manually bridge them. Insider One is built as a single connected system, unified profiles in the Actionable CDP, real-time journey execution via Architect, predictive intelligence from Sirius AI™, and autonomous action through Agent One™. That means no stitching across vendors, no lag between signal and response, and no separate contract for each function. For brands evaluating platforms, that integration is the difference between a dashboard that reports and a system that acts.
At Insider One, we developed our platform (from the Actionable CDP to Agent One™) to ensure teams operate from a shared understanding of what the data actually reveals. By connecting behavioral triggers to real-time orchestration, and automating execution through Agent One™, our autonomous AI agent layer, we help brands move beyond passive reporting into proactive, self-improving engagement. The gap between seeing a signal and acting on it is where revenue is lost. Insider One closes it.
Don’t let another signal slip through the cracks. Book a demo to see how Insider One turns every customer interaction into timely, revenue-driving action.
FAQs
Web analytics tracks anonymous site performance through aggregate data points like bounce rates and sessions.
Whereas, customer engagement analytics monitors individual identity and behavior across every touchpoint over time. It links specific behavioral signals to long-term financial outcomes such as CLV and retention.
A Customer Engagement Score (CES) is a composite metric derived from high-intent actions, including purchase frequency, wishlist updates, and support interactions. Each event receives a weight based on its historical correlation with retention.
Insider One’s CDP calculates these scores dynamically. When a CES declines, the system triggers a response to prevent a permanent lapse in the relationship.
AI identifies complex patterns within behavioral data that human analysts cannot process at speed or scale. Sirius AI™ applies predictive modeling to score churn risk, purchase intent, and optimal channel affinity for each customer individually, not as a segment average. As described in the retention section above, this means a customer showing early disengagement signals receives the right offer, on the right channel, at the right time, automatically. Agent One™ then executes that action without a manual campaign build. The result is high-precision engagement that scales without scaling headcount.
A robust program integrates behavioral data from websites and apps with cross-channel messaging metrics and CRM transaction history. Incorporating qualitative data from support interactions and post-purchase feedback provides the context for customer actions.
Unifying these disparate sources into a single customer profile is essential for making the data actionable.
Measurable improvements in segment-specific conversion and churn reduction typically appear within 60 to 90 days of implementation. Brands focusing on a high-impact use case (such as at-risk re-engagement) see the fastest results.
Comprehensive ROI, including total cost of ownership savings through tool consolidation and sustained CLV growth, generally materializes within 6 to 12 months.