In 2026, customer engagement is what separates marketing that works from marketing that wastes budget. Privacy changes have reshaped digital tracking. AI has raised expectations for personalization. Clicks and impressions? They barely scratch the surface anymore.
What matters now is whether people are connecting with your brand: opening emails, spending time on your site, responding to messages, coming back to buy again.
The data backs this up. McKinsey’s ConsumerWise Sentiment Survey covers over 25,000 consumers across 18 markets, representing roughly 75% of global GDP. It reveals how preferences, trust patterns, and engagement behaviors are shifting.
This article breaks down seven customer engagement metrics you need to track in 2026 and why they’ll shape your growth.
How to measure customer engagement and why it matters
There’s no single formula for measuring customer engagement. The strongest approach blends quantitative data, customer feedback, and the platforms your teams already use. This mix reveals not just what people do, but how they feel and why they make certain choices.
Measure customer engagement the right way
The best approach to measuring customer engagement combines numbers, feedback, and your existing platforms. That mix shows not just what people do, but how they feel.
Quantitative metrics
Product usage data monitors DAU, WAU, and MAU to reveal how frequently people use your product. A low ratio between daily and monthly active users signals weak stickiness or inconsistent value. Pair this with churn and feature adoption to understand whether new updates are keeping customers engaged.
Marketing performance tracks click-through rate, open rate, conversions, and time on page. These indicators show whether your campaigns resonate and whether customers find your content relevant.
Customer service outcomes include CSAT for a quick pulse on satisfaction, First Contact Resolution to show how effectively your team solves problems on the first attempt, and NPS to reflect how willing customers are to recommend your brand and spotlight long-term loyalty.
Qualitative insights
Numbers reveal patterns, but they can’t always explain the reasons behind them. Feedback from surveys, interviews, product reviews, and social listening clarifies motivations, frustrations, and expectations. These insights add context your quantitative data can’t provide on its own.
Why it matters
Engaged customers create more value over time. They buy more frequently, stick around longer, and they’re less likely to churn. When you monitor the right engagement metrics, you can refine campaigns, improve experiences, and prioritize product updates that strengthen long-term relationships.
Metric 1: Customer Lifetime Value (CLV)
Why track it
Tracking Customer Lifetime Value helps you understand which customers contribute the most revenue over time. This insight strengthens revenue forecasting and clarifies where additional investment will deliver the greatest impact.
When you identify your highest-value segments, you can reallocate budget more effectively, enhance loyalty initiatives, and focus acquisition efforts on customers who are most likely to deliver long-term growth.
How to calculate
There are different levels of calculation:
- Basic approach: Multiply the average transaction value by purchase frequency, then by customer lifespan. That gives you a simple estimate of CLV.
- Advanced models: Add in retention rates, churn, gross margin, and predictive analytics to estimate future profit from each customer or segment.
Example in action
A subscription business has one group of customers paying $20 a month and staying active for two years. That segment’s CLV comes to around $480. Another set of customers spends more or sticks around longer, pushing their CLV closer to $700. That insight shows marketers where to put more budget, which groups deserve extra attention, and how to keep acquisition and retention in balance.
Metric 2: Net Promoter Score (NPS)
Net Promoter Score (NPS) measures customer loyalty. It asks customers how likely they are to recommend a brand to others, scoring answers from 0 to 10.
Customers are categorized as promoters, passives, or detractors, giving businesses a snapshot of satisfaction and advocacy. The NPS is calculated by subtracting the percentage of detractors from the percentage of promoters.
Why track it
Net Promoter Score provides a straightforward way to gauge customer sentiment. A high score indicates trust in your brand and a higher likelihood of repeat business. It can also signal potential referrals. Many teams use NPS as a quick benchmark to measure performance against industry standards.
Pairing with qualitative feedback
NPS alone shows the score, not the reasons behind it. Including at least one open-ended question provides context and helps teams understand and address real customer concerns.
Example in action
Your NPS drops from 50 to 35 after rolling out a new product feature. Feedback points to confusion with the interface. When you fix usability issues and update support materials, you not only improve the experience but also see your NPS rebound in the following quarter. This shift shows how directly NPS connects to
customer experience improvements.
Metric 3: Active users (DAU/WAU/MAU and stickiness)
Alt Text: DAU/WAU/MAU
DAU, WAU, and MAU count how many people use your product in a given period. Teams handle this differently. One group might check numbers daily. Others look monthly. Over time, patterns become clear. People either come back or they start dropping off.
Stickiness
Stickiness is measured by dividing DAU by MAU. The ratio shows the percentage of your monthly users who engage with your product on a given day. A higher stickiness percentage means customers are making it part of their routine.
Why track it
Checking DAU, WAU, and MAU gives you a quick read on habits. You’ll see if people are showing up often or if activity is fading. When stickiness is strong, customers show loyalty. A dip signals trouble, like churn risk or a feature that’s not working as expected. Tracking these metrics together helps gauge product health and spot opportunities for reengaging customers before they drift away.
Example in action
After a feature launch, daily active users rise from around 1,000 to 1,300. That increase suggests stronger stickiness, meaning more people are returning regularly.
But sometimes the numbers tell a different story. Monthly active users may grow while daily active users stay flat, indicating many sign-ups but limited repeat visits. In those cases, it’s worth reviewing onboarding or the clarity of feature guidance, since users may drop off before realizing the feature’s value.
Metric 4: Time to Value (TTV) and activation rate
Time to Value (TTV) refers to the period between a customer’s sign-up and their first experience of a meaningful benefit from your product. Activation rate refers to the percentage of customers who reach that initial milestone early in their journey.
Why track it
Customers who see value sooner are more likely to stay. A shorter TTV reduces the chance of churn, while a higher activation rate shows that onboarding is effective. Together, these metrics show how fast and how often new users reach their first success.
Example in action
Cut onboarding time from three days to one, and new users experience value right away. That speed often boosts activation and helps keep customers engaged in the early stages. You may also notice a decline in support requests and higher first-month usage, clear signs that the new onboarding flow makes it easier for customers to succeed right away.
Metric 5: Feature adoption and engagement rate
Feature adoption rate measures the share of users who make use of a specific feature compared to the total user base. The engagement rate looks at how often and how deeply those users interact with the feature once they start.
A simple way to calculate adoption is to divide the number of users who tried the feature by the total number of users and then multiply by 100 to get a percentage.
Why track it
Adoption and engagement indicate whether a feature is effective or not. High adoption usually means people see the point.
Low numbers often mean they don’t know about it, or it’s clunky to use. Engagement reveals whether people keep using a feature or abandon it after one try.
Those signals can guide product managers on what to fix or expand. They also provide marketing with a clue about which features to push harder.
Example in action
Suppose your company launches a new reporting dashboard, but only 10% of users engage with it weekly. To uncover why, you roll out an interactive onboarding tour that highlights real use cases and benefits.
After A/B testing, adoption jumps to 18%, and repeat logins rise 25%. The data makes it clear: customers weren’t ignoring the feature; they just needed better guidance. Strong onboarding and reengagement nudges turned a low-use feature into a core part of the product experience.
Metric 6: Conversion rate and pages per session
Alt Text: Conversion Rate
Conversion rate measures how many visitors complete a desired action, such as filling out a form, making a purchase, or signing up for a trial. Pages per session tracks how many pages a user visits in a single session, giving insight into how deeply they explore your content.
Why track it
Conversion rate is a key indicator of whether your site or app effectively encourages action. Pages per session complements this by showing engagement levels before conversion. More pages per session suggest that your design motivates users to explore and find value, helping them make informed decisions.
Example in action
If product pages have a low conversion rate, redesigning them with clearer calls to action and supporting recommendations can help. After such updates, you may see both conversion rate and pages per session rise. Visitors explore more content, feel more confident in their choices, and ultimately convert at higher rates.
Metric 7: Customer satisfaction and support metrics
CSAT, or Customer Satisfaction Score, is a quick way to measure how happy customers are right after an interaction.
It’s usually gathered with a short survey. FCR, or First Contact Resolution, looks at how many issues get solved the first time a customer reaches out, whether that’s by phone, chat, or email.
Why track it
Tracking CSAT and FCR together provides a strong view of support performance. High CSAT is a good sign that customers are happy with the support they received. FCR focuses on the frequency of problems solved on the first try, thereby saving people from having to reach out again.
When FCR improves, CSAT usually goes up as well. The result is stronger loyalty and lower churn, since customers value quick, simple resolutions.
Example in action
A company reviews its support operations and finds its FCR rate at 65%, with CSAT averaging 78%. After updating its routing process and improving self-service resources, FCR rises to 75%. Shortly after, CSAT improves to 85%, showing that faster resolutions directly impact customer satisfaction.
Find the metrics that match your goals
Now that the main engagement metrics are on the table, focus on selecting the ones that match your business needs.
Begin with a smaller set that directly aligns with your goals.
- Retail brands often track conversion rate and pages per session to see if campaigns are turning into sales.
- SaaS businesses rely on CLV, TTV, or DAU/MAU because these metrics highlight retention and ongoing product use.
- Young startups often zero in on activation and adoption because those early signals reveal whether customers see value quickly.
- Large enterprises rely on loyalty and satisfaction scores, such as NPS or CSAT, to gauge consistency and long-term trust.
It also helps to combine metrics rather than look at them in isolation:
- CSAT with FCR provides a clear picture of both customer satisfaction and the speed at which support teams resolve issues.
- Feature adoption with DAU or MAU shows not only if a feature is being used but also whether it encourages customers to return regularly.
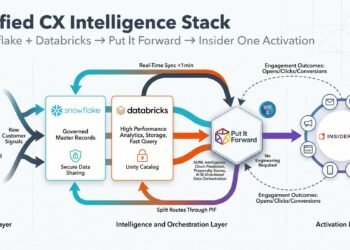
A platform like Insider One makes this process more effective by centralizing data from marketing, product usage, customer support, and loyalty programs. Insider One builds unified customer profiles that combine past behavior, real-time activity, and predictive insights.
Its reporting and analytics tools include:
- Real-time dashboards across channels such as web, app, email, SMS, and WhatsApp
- Funnel and flow analysis to identify drop-offs and highlight successful paths
- Retention cohorts and event-level insights to track long-term value
- Performance reports covering conversions, subscriber trends, revenue by channel, and incremental gains
With measurement and execution integrated into a single system, teams can respond quickly and allocate resources to strategies that yield the strongest results.
With Insider One’s Agent One, AI turns insights into personalized campaigns at scale.
These autonomous AI agents elevate engagement by making decisions, interacting, and executing across channels with minimal human intervention. They:
- Act proactively: Identify opportunities and take action without prompts.
- Engage naturally: Understand context, tone, and intent for more human-like interactions.
- Focus on results: Track deeper signals such as conversions, retention, and customer satisfaction.
- Adapt in real time: Respond instantly to changing behavior and context.
Track metrics to drive measurable growth with Insider One
Customer engagement is still one of the clearest signals of business performance. You might look at metrics like CLV, NPS, DAU or MAU, and even things like TTV, activation, or feature adoption. Conversions, CSAT, and FCR all play a role. They show different points where people connect with your brand.
Teams are also tracking XLOs (Experience Level Objectives), aligning customer expectations with the outcomes your business delivers. Regularly monitoring these metrics helps spot trends early, adjust targeting, and retain customers longer, building a stronger foundation for growth.
Insider One makes this process seamless by centralizing data across channels. Real-time insights enable teams to act quickly, converting engagement metrics into tangible results.
Book a demo with Insider One now and discover how its reporting and analytics tools can help you drive growth!
FAQs
For new businesses, activation rate and time to value are often the most important starting points. They highlight whether customers quickly experience value, which is crucial for early retention.
DAU, MAU, and conversion rates change rapidly, so it’s advisable to check them frequently, ideally daily or weekly. Metrics such as CLV, NPS, or CSAT tend to shift more slowly. For those, a monthly or quarterly review is usually enough to spot meaningful changes.
A vanity metric looks good but does not actually guide decisions. Page views are a common example. On their own, they say little, but once tied to results like conversions or revenue, they become useful.
Yes. CLV, CSAT, and NPS can be tracked across digital and offline touchpoints. The key is to pull offline data into your reporting, ensuring you don’t miss half the story.