JAX on Cloud TPUs provides powerful acceleration for machine learning workflows. When working in distributed cloud environments, you need specialized tools to debug your workflows, including accessing logs, hardware metrics, and more. This blog post serves as a practical guide to various debugging and profiling techniques.
Choosing the right tool: Core Components and Dependencies
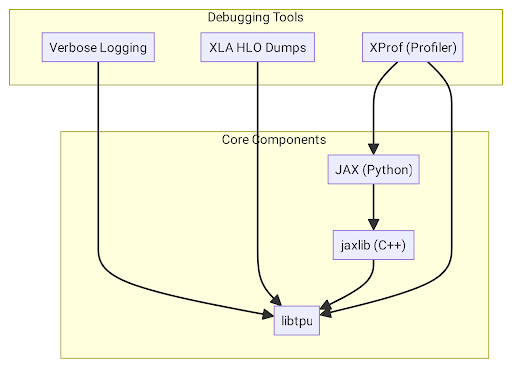
At the heart of the system are two main components that nearly all debugging tools depend on:
- libtpu (which contains libtpu.so, the TPU Runtime): This is the most fundamental piece of software. It’s a shared library on every Cloud TPU VM that contains the XLA compiler, the TPU driver, and the logic for communicating with the hardware. Almost every debugging tool interacts with or is configured through libtpu.
- JAX and jaxlib (The Framework): JAX is the Python library where you write your model code. jaxlib is its C++ backend, which acts as the bridge to libtpu.so
The relationship between these components and the debugging tools is illustrated in the diagram below.
Here is a breakdown of the specific tools, their dependencies, and how they relate to each other.
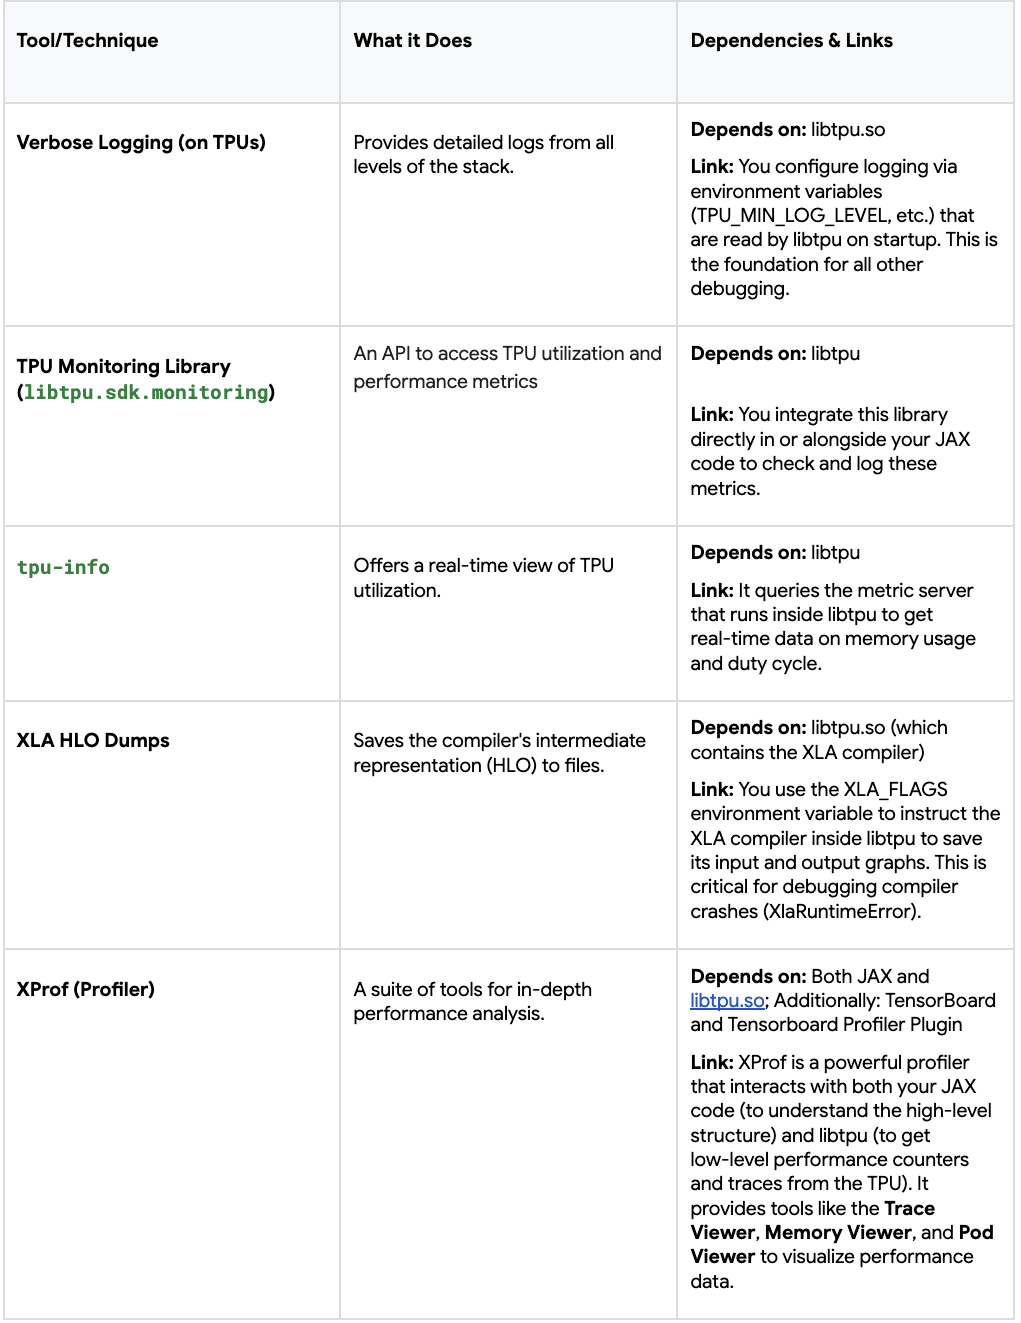
In summary, libtpu is the central pillar that most debugging tools rely on, either for configuration (logging, HLO dumps) or for querying real-time data (monitoring, profiling). Other tools, like XProf, also operate at the Python level to inspect the state of your JAX program directly. By understanding these relationships, you can more effectively choose the right tool for the specific issue you are facing.
Essential Logging and Diagnostic Flags for Every Workload
Verbose Logging
The most critical step for debugging is to enable verbose logging. Without it, you are flying blind. These flags should be considered on every worker of your TPU slice, to log everything from TPU runtime setup to program execution steps with timestamps
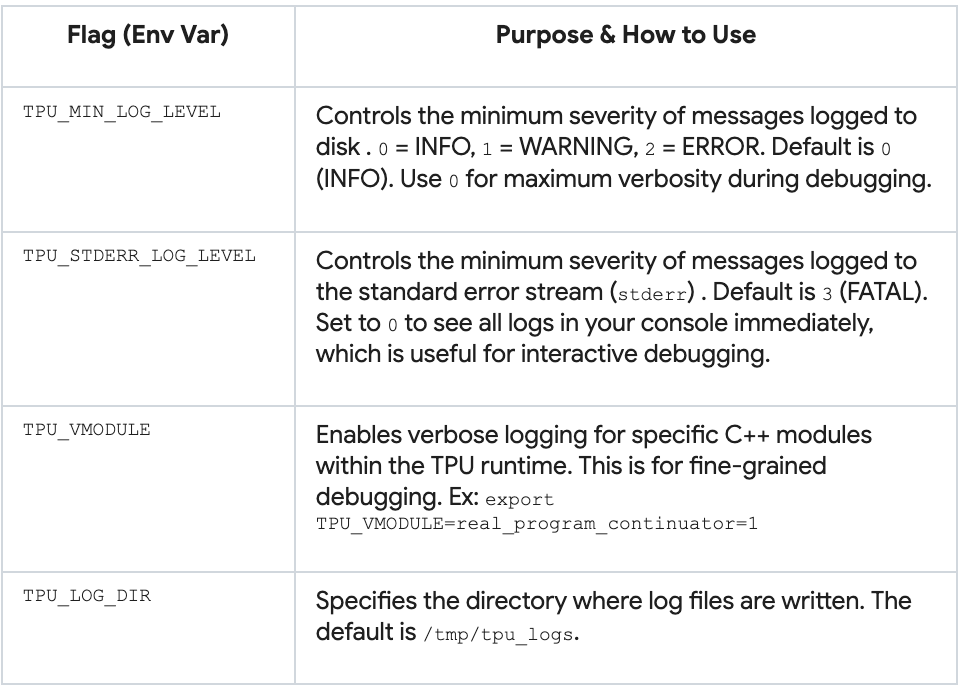
If you want to enable the above default flags on every TPU worker nodes, run the following command:
gcloud alpha compute tpus queued-resources ssh ${QUEUED_RESOURCE_ID} --project ${PROJECT_ID} \
  --zone ${ZONE} --worker=all --node=all \
  --command='TPU_VMODULE=slice_configuration=1,real_program_continuator=1 TPU_MIN_LOG_LEVEL=0 TF_CPP_MIN_LOG_LEVEL=0 TPU_STDERR_LOG_LEVEL=0 python3 -c "import jax; print(f\"Host {jax.process_index()}: Global devices: {jax.device_count()}, Local devices: {jax.local_device_count()}\")"'
Plain text
Libtpu logs are automatically generated in /tmp/tpu_logs/tpu_driver.INFO on each TPU VM. This file is your ground truth for what the TPU runtime is doing. To get logs from all TPU VMs, you can run the following bash script:
#!/bin/bash

TPU_NAME="your TPU TPU_NAME"
PROJECT="project for your TPU"
ZONE="zone for your TPU"
BASE_LOG_DIR="path to where you want the logs to be downloaded to"

NUM_WORKERS=$(gcloud  compute tpus tpu-vm describe $TPU_NAME --zone=$ZONE --project=$PROJECT | grep tpuVmSelflink | awk -F'[:/]' '{print $13}' | uniq | wc -l)

echo "Number of workers = $NUM_WORKERS"

for ((i=0; i<$NUM_WORKERS; i++))
do
  mkdir -p ${BASE_LOG_DIR}/$i
  echo "gcloud compute tpus tpu-vm scp  ${TPU_NAME}:/tmp/tpu_logs/*  ${BASE_LOG_DIR}/$i/  --zone=${ZONE} --project=${PROJECT} --worker=$i"
  echo "Download logs from worker=$i"
  gcloud compute tpus tpu-vm scp  ${TPU_NAME}:/tmp/tpu_logs/*  ${BASE_LOG_DIR}/$i/  --zone=${ZONE} --project=${PROJECT} --worker=$i
done
Plain text
On Google Colab, you can set the above environment variables using os.environ, and access the logs in the “Files” section in the left sidebar.
Here are some example snippets from a log file:
...
I1031 19:02:51.863599     669 b295d63588a.cc:843] Process id 669
I1031 19:02:51.863609     669 b295d63588a.cc:848] Current working directory /content
...
I1031 19:02:51.863621     669 b295d63588a.cc:866] Build tool: Bazel, release r4rca-2025.05.26-2 (mainline @763214608)
I1031 19:02:51.863621     669 b295d63588a.cc:867] Build target:
I1031 19:02:51.863624     669 b295d63588a.cc:874] Command line arguments:
I1031 19:02:51.863624     669 b295d63588a.cc:876] argv[0]: './tpu_driver'
...
 19:02:51.863784     669 init.cc:78] Remote crash gathering hook installed.
I1031 19:02:51.863807     669 tpu_runtime_type_flags.cc:79] --tpu_use_tfrt not specified. Using default value: true
I1031 19:02:51.873759     669 tpu_hal.cc:448] Registered plugin from module: breakpoint_debugger_server
...
I1031 19:02:51.879890     669 pending_event_logger.cc:896] Enabling PjRt/TPU event dependency logging
I1031 19:02:51.880524     843 device_util.cc:124] Found 1 TPU v5 lite chips.
...
I1031 19:02:53.471830     851 2a886c8_compiler_base.cc:3677] CODE_GENERATION stage duration: 3.610218ms
I1031 19:02:53.471885     851 isa_program_util_common.cc:486] (HLO module jit_add): Executable fingerprint:0cae8d08bd660ddbee7ef03654ae249ae4122b40da162a3b0ca2cd4bb4b3a19c
Plain text
TPU Monitoring Library
The TPU Monitoring Library is a way to programmatically gain insights about workflow performance on TPU hardware (utilization, capacity, latency, and more). It is a part of the libtpu package, which is automatically installed (as a dependency) with jax[tpu], so you can start using the monitoring API directly.
# Explicit installation
pip istall "jax[tpu]" libtpu
Shell
You can view all supported metrics with tpumonitoring.list_supported_metrics() and get specific metrics with tpumonitoring.get_metric. For example, the following snippet prints the duty_cycle data and description:
from libtpu.sdk import tpumonitoring

duty_cycle_metric = tpumonitoring.get_metric("duty_cycle_pct")
duty_cycle_data = duty_cycle_metric.data
print("TPU Duty Cycle Data:")
print(f"  Description: {duty_cycle_metric.description}")
print(f"  Data: {duty_cycle_data}")
Python
You would typically integrate tpumonitoring directly in your JAX programs, during model training, before inference, etc. Learn more about the Monitoring Library in the Cloud TPU documentation.
tpu-info
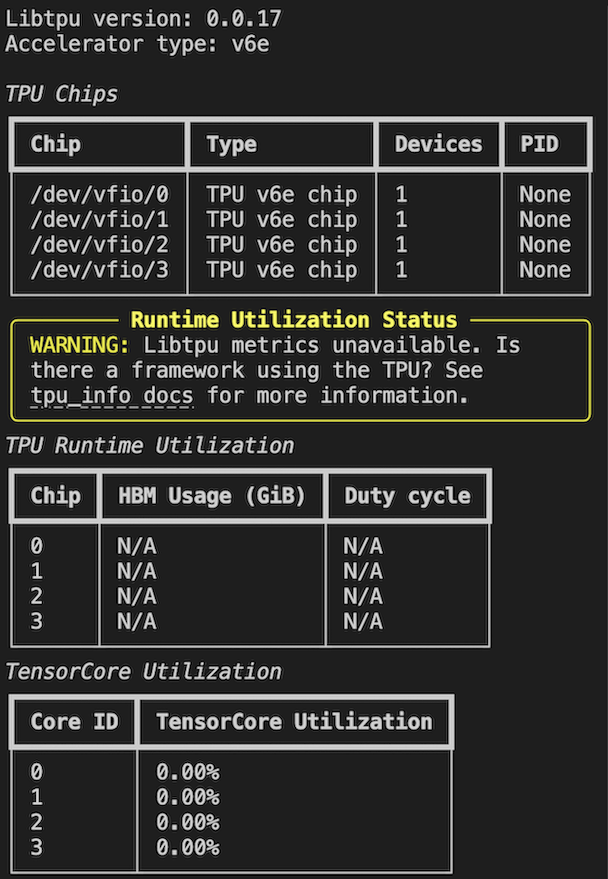
The tpu-info command-line tool is a simple way to get a real-time view of TPU memory and other utilization metrics, similar to nvidia-smi for GPUs.
Install on all workers and nodes
gcloud alpha compute tpus queued-resources ssh ${QUEUED_RESOURCE_ID} --project ${PROJECT_ID} \
  --zone ${ZONE} --worker=all --node=all \
  --command='pip install tpu-info'
Plain text
SSH into one worker and node to check chip utilization metrics
gcloud alpha compute tpus queued-resources ssh ${QUEUED_RESOURCE_ID} --project ${PROJECT_ID} \
  --zone ${ZONE} --worker=0 --node=0

tpu-info
Plain text
When chips are in use, process IDs, memory usage, and duty cycle% will be displayed
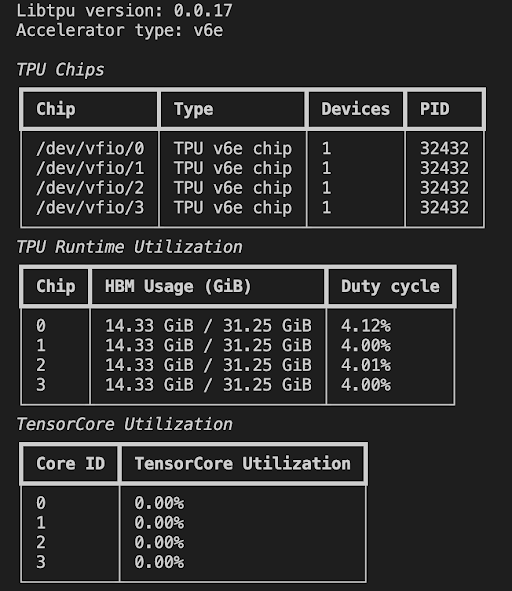
When no chips are in use, the TPU VM will show no activity
Learn more about other metrics and streaming mode in the documentation.
In this post, we discussed some TPU logging and monitoring options. Next in this series, we’ll explore how to debug your JAX programs starting with generating HLO dumps, and profiling your code with the XProf.