If a competitor is mentioned more often, cited more frequently, or framed more favorably in AI answers, they win attention and trust before searchers even know you exist.
This guide shows you how to run an AI search competitor analysis that reveals:
- Which brands in your industry dominate AI search today
- Where your competitors earn visibility, but you don’t
- Which topics, pages, and sources drive their advantage
- What to prioritize to close the gap fast
It’s a step-by-step process you can repeat quarterly, or whenever a new competitor, model update, or internal priority change (such as when you launch a new product) hits your radar.
Want to turn this analysis into a report for stakeholders?
Download the AI Search Competitor Analysis Report Template, a ready-made framework to document visibility gaps, ranking strength, and where your competitors are winning in AI search.
It includes:
- A competitor SWOT analysis for AI visibility
- A topic gap matrix to show who owns which themes
- An action plan section with priority ratings for stakeholders
Use the step-by-step process in this guide to fill it in with real insights and turn raw data into a clear plan your team can act on.
There are three main types of competitors you compete with for AI visibility:
- Those that AI mentions you alongside
- Those that AI cites as a source instead of you
- Those that your audience compares to you when using AI search
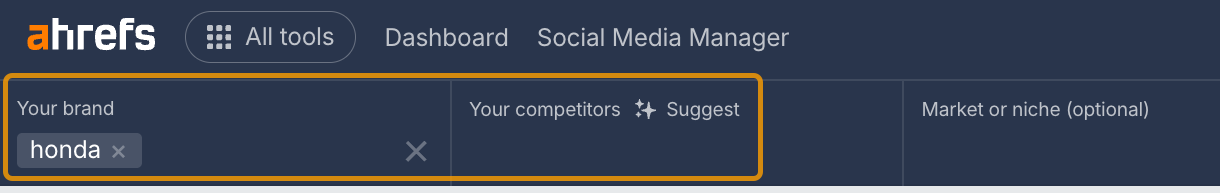
You can find all three in Ahrefs’ Brand Radar. For instance, if you enter your brand, you can use the AI suggest feature to list other similar brands to yours:
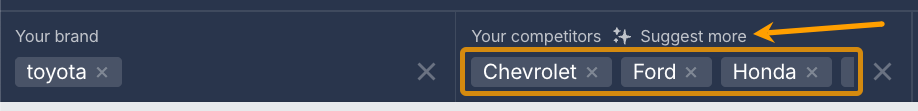
These will typically be competitors you’re aware of and that you compete with for brand mentions in AI responses.
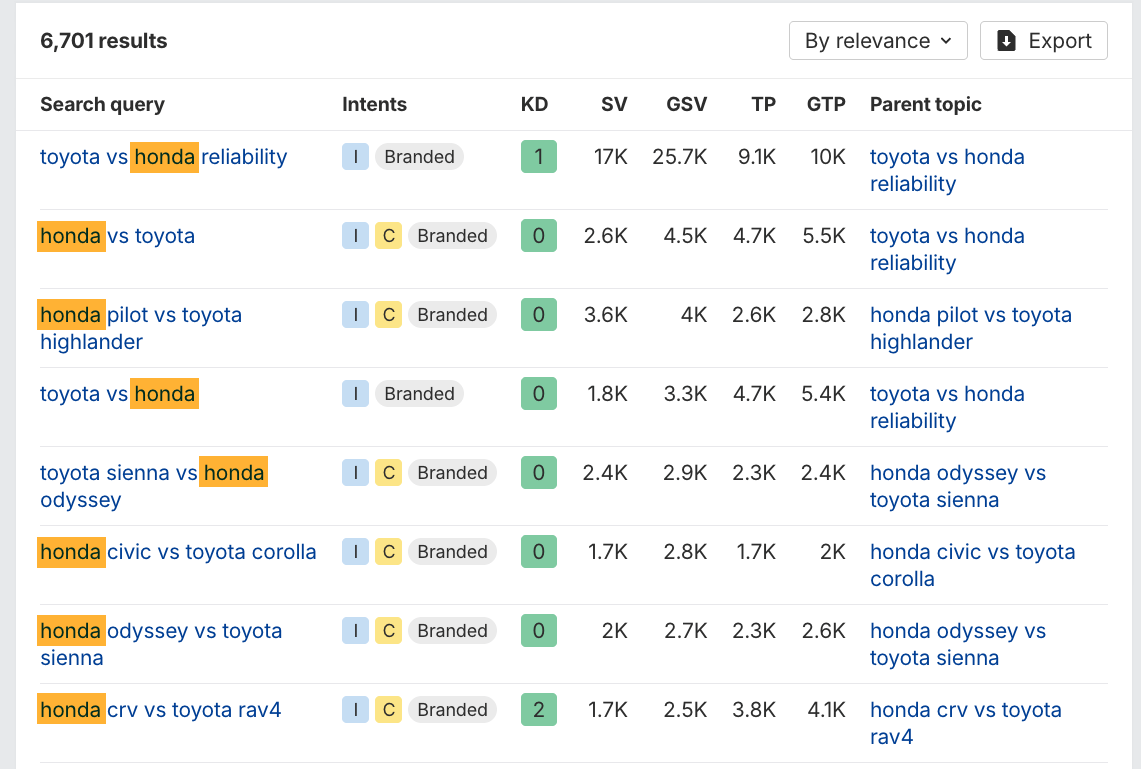
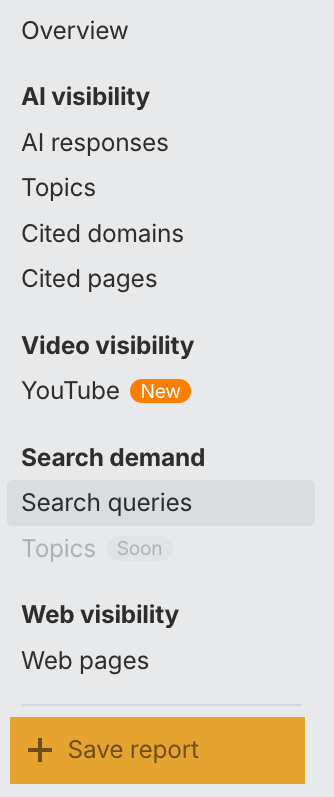
If you check out the Search queries report, you’ll be able to find the competitors that your audience frequently compares you to. You can filter the data by looking for queries that contain your brand and words with comparative intent, like “vs”:
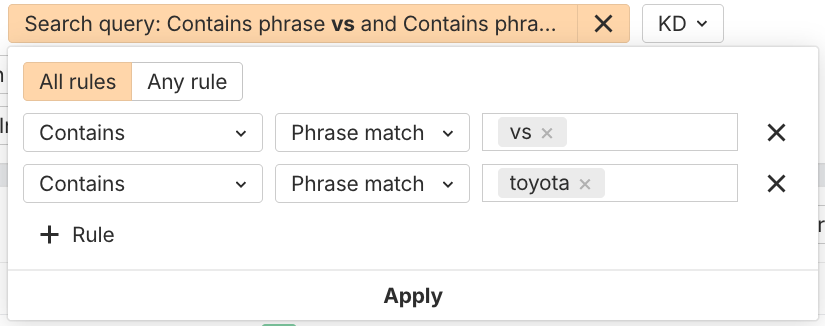
For example, Honda is a strong competitor of Toyota’s that searchers frequently compare:
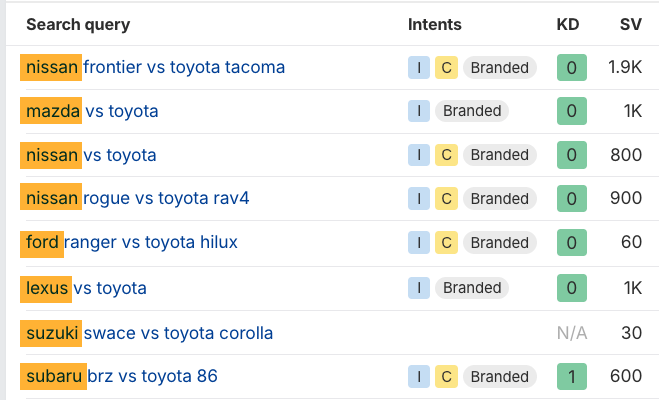
Other brands that are commonly compared to Toyota include Nissan, Mazda, Ford, Lexus, Suzuki, and Subaru:
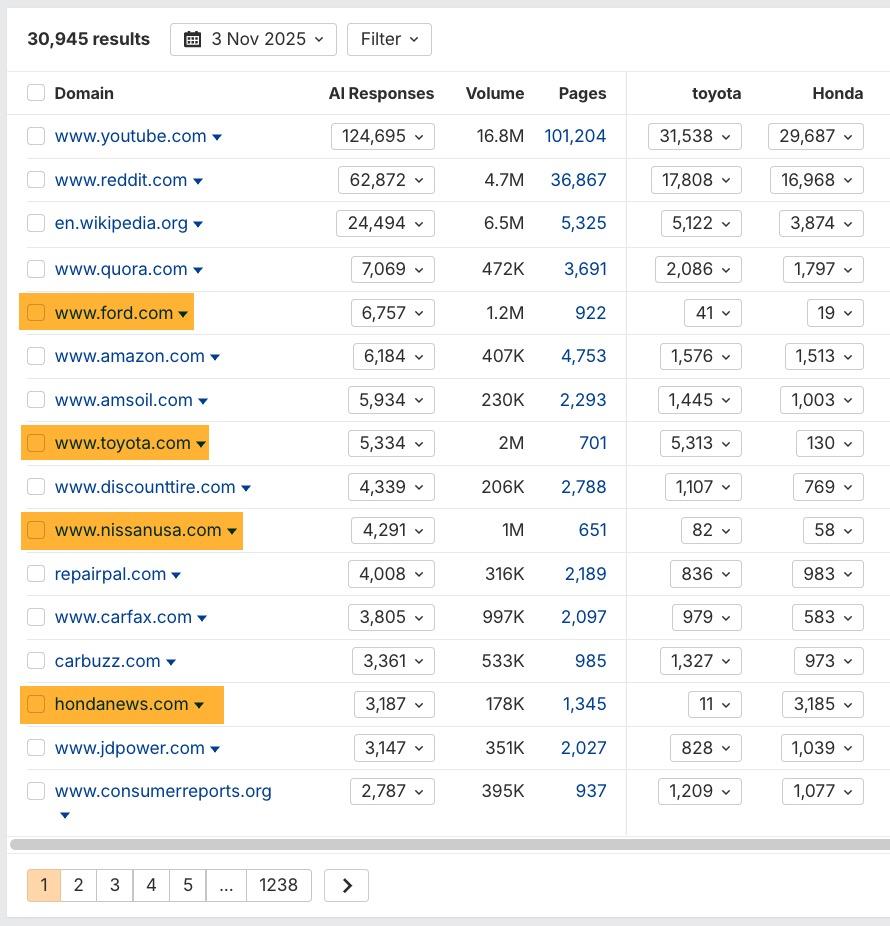
To find competitors that are cited as sources, check out the Cited domains report.
More often than not, you’ll see general sites like Wikipedia, Reddit, or social media in the top spots. These sites are too large and authoritative to compare against in most cases.
But you’ll also spot other sites in your industry that get cited more than your brand. Sometimes they’ll be industry publications. Other times, they’ll be direct competitors, like Ford, Nissan, and Honda, in the example below:
Select the ones that make the most sense for your analysis or that your stakeholders care about the most.
After you finalize the list of brands and websites to compare for your competitor analysis, you’ll need to define the entities you’d like to receive data for. Entities are the core people, brands, products, and topics that search engines can uniquely identify and connect to your business.
You can do this in the search bar by clicking the option to add variations as you enter each brand:
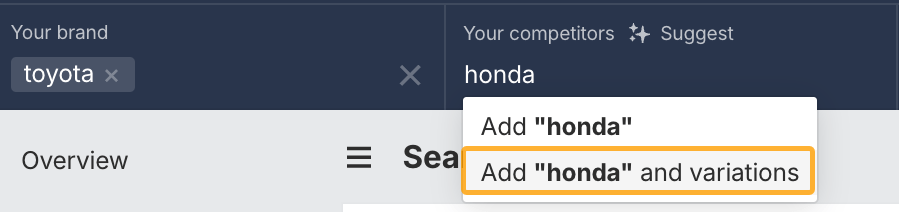
For a simple analysis, add the main brand and its domain:
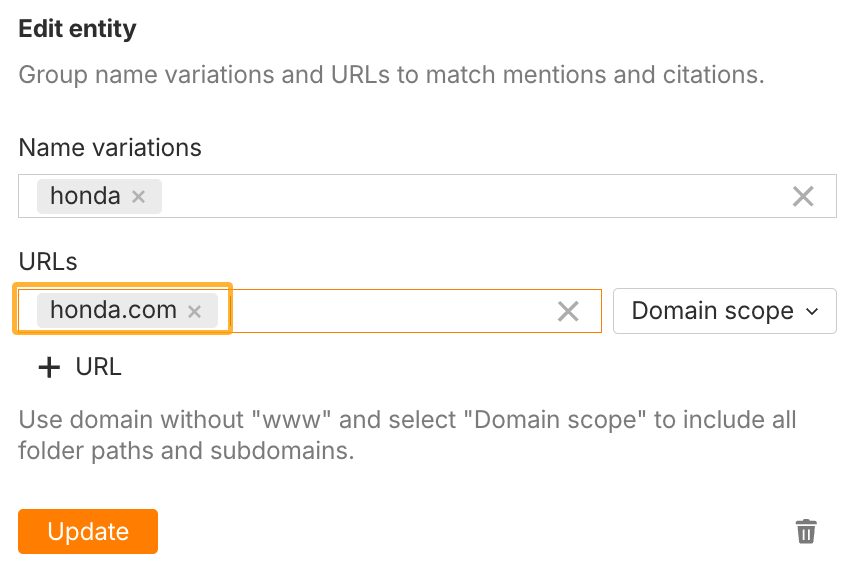
Do this for your brand and each of your competitors.
For a more comprehensive analysis, you can also add all products, sub-brands, and other owned websites to these fields. This will give you deeper insights into each brand’s visibility at a detailed level.
For example, for Honda, you could include products that are searched for directly, such as the Honda CR-V, Honda Accord, and Honda Civic. You could also add its domains like honda.com, global.honda and honda.com.au :
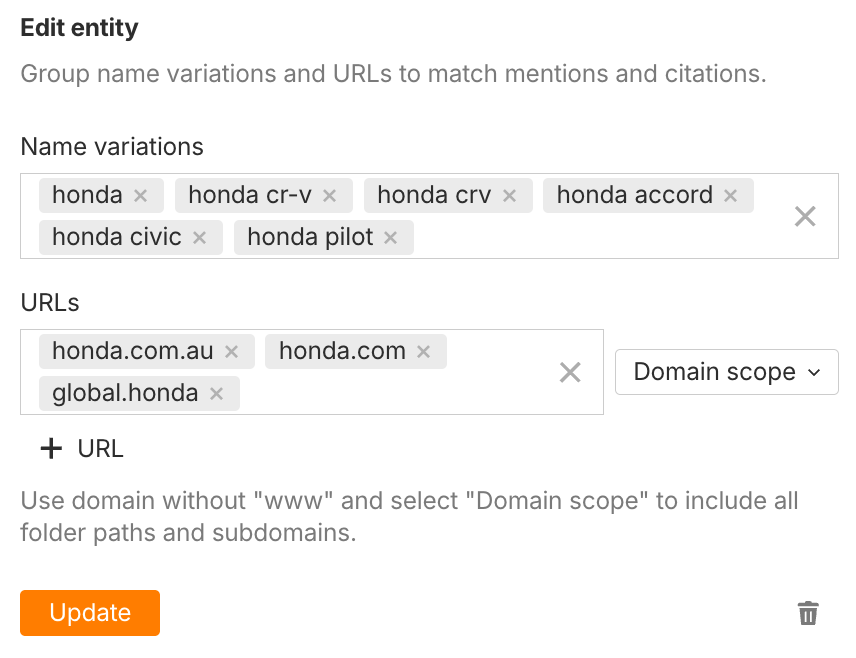
This is a limited example to give you an idea of what you can add for your brand and competitors. Take the time to fill these out entirely if you’re seeking a comprehensive analysis of each brand.
Sidenote.
Remember, if you’re in a hurry or your team only needs high-level visibility, keep it simple. Stick with the main brand and domain only and skip sub-entities for now.
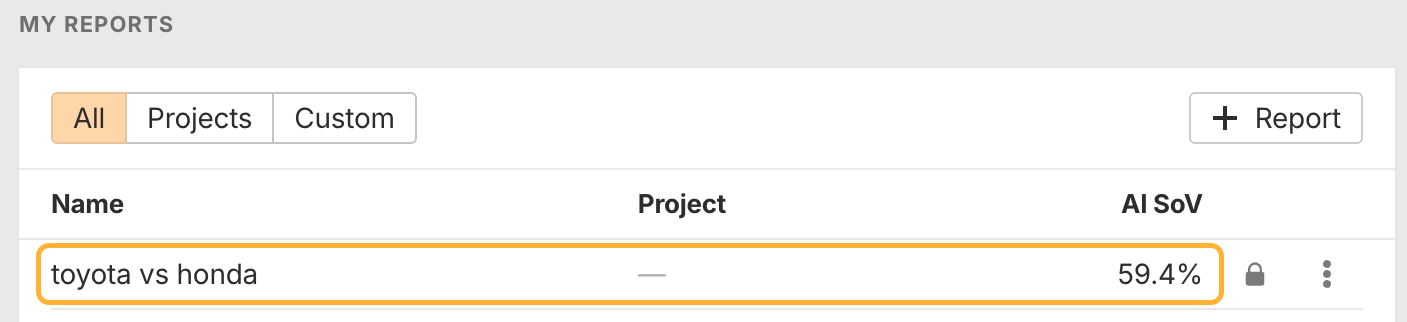
Once you’re done, save the report so it becomes a preset you can return to at any time to compare changes in AI visibility:
It will then show up on the main screen of Brand Radar alongside any other saved reports that you can always revisit in the future:
This completes the setup, and you can now start benchmarking and analyzing the data.
To start benchmarking, check out the Overview report in Brand Radar. Take note of how metrics like your brand’s mentions, citations, impressions, and Share of Voice change across various AI search platforms:
- Mentions: The number of times your brand is mentioned in AI responses.
- Citations: The number of times your brand’s website is cited as a source in AI responses.
- Impressions: An estimation of exposure based on how often responses containing your brand are shown in search results.
- AI Share of Voice: How often your brand is mentioned in AI responses compared to competitors.
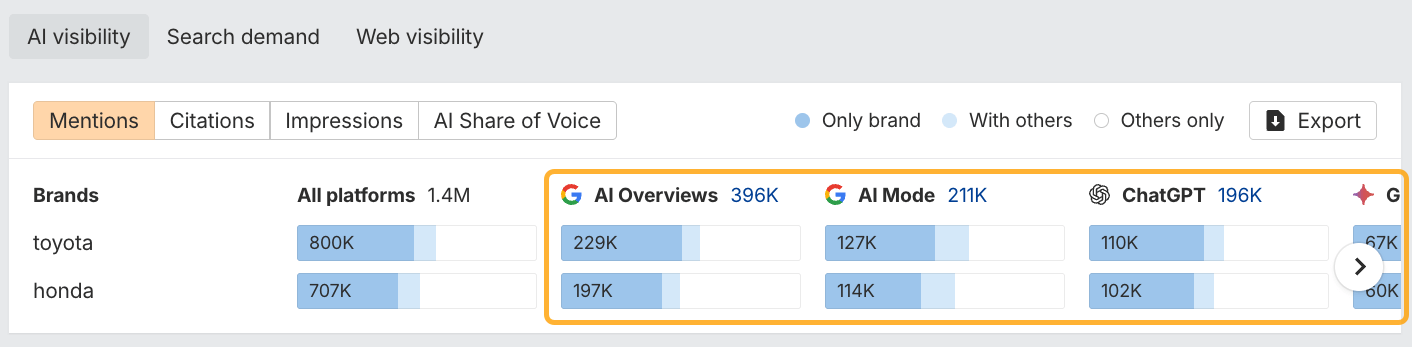
You can also directly compare your brand to competitors for each AI search platform:
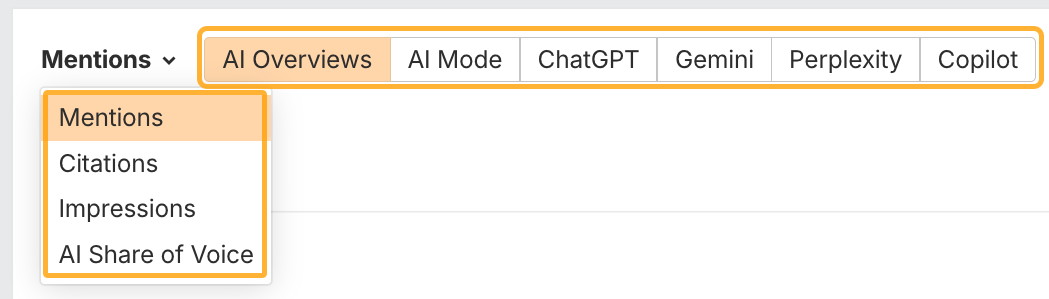
And also for each metric:
Keep a record of all these benchmark metrics so you can compare them against each other in the future.
Once you’ve benchmarked the basic visibility metrics, it’s time to look deeper. Unlike traditional SEO metrics, AI visibility extends beyond measuring if you appear. How you show up is equally important.
Open the AI Responses report in Brand Radar to see how each of the brands in your analysis is mentioned in AI-generated answers.
Start by hovering over one of the brands and selecting the “Only brand” option:
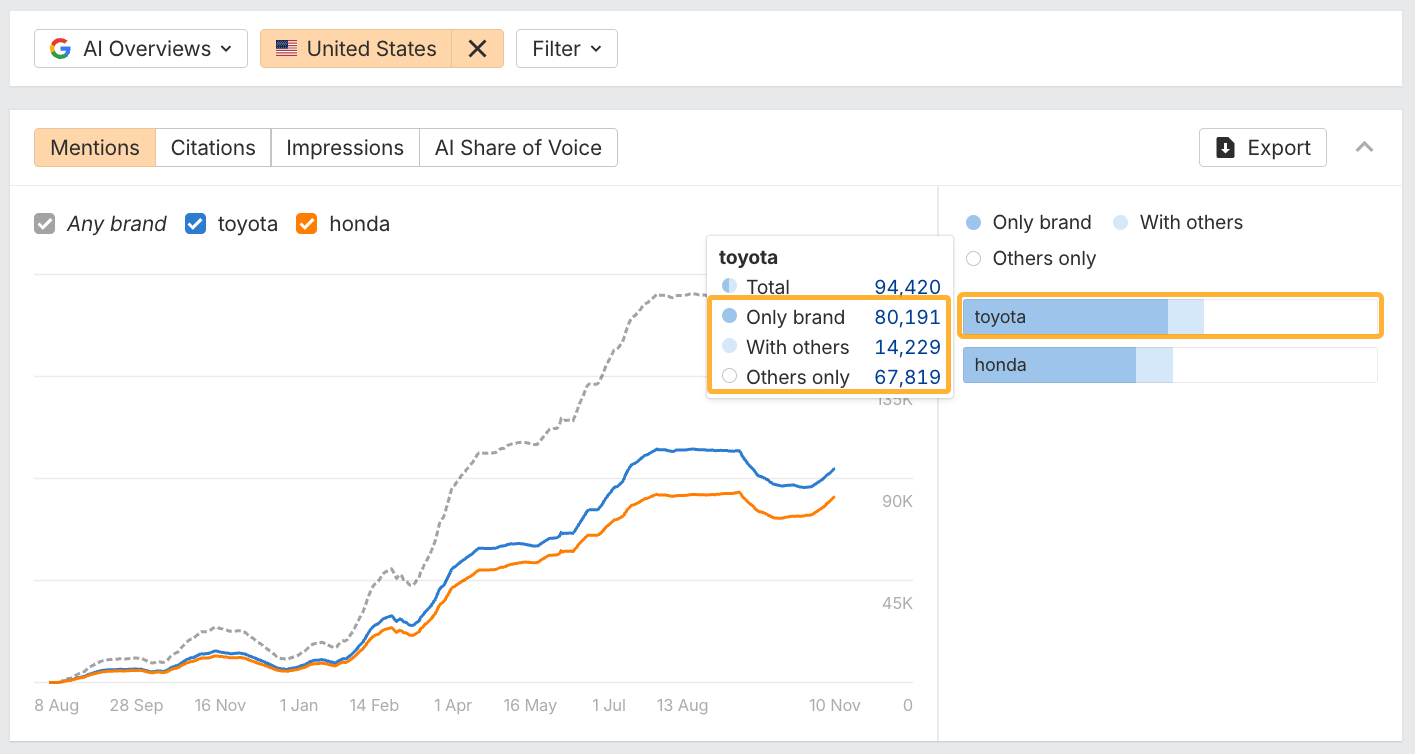
You can also select the other options depending on what type of analysis you want to do:
- Only brand: This report will show you queries and AI answers where the only brand mentioned is the one you’ve selected. It is great for assessing brand-specific queries and responses.
- With others: This report shows queries and/or responses that contain all the brands you’re comparing. It is great for assessing topics that are likely to mention you alongside competitors.
- Others only: This report shows queries that only mention the other brands you’re comparing against. It is great for finding topics that mention your competitors but not you.
Look for common language patterns for each brand and how AI differentiates one brand from another:
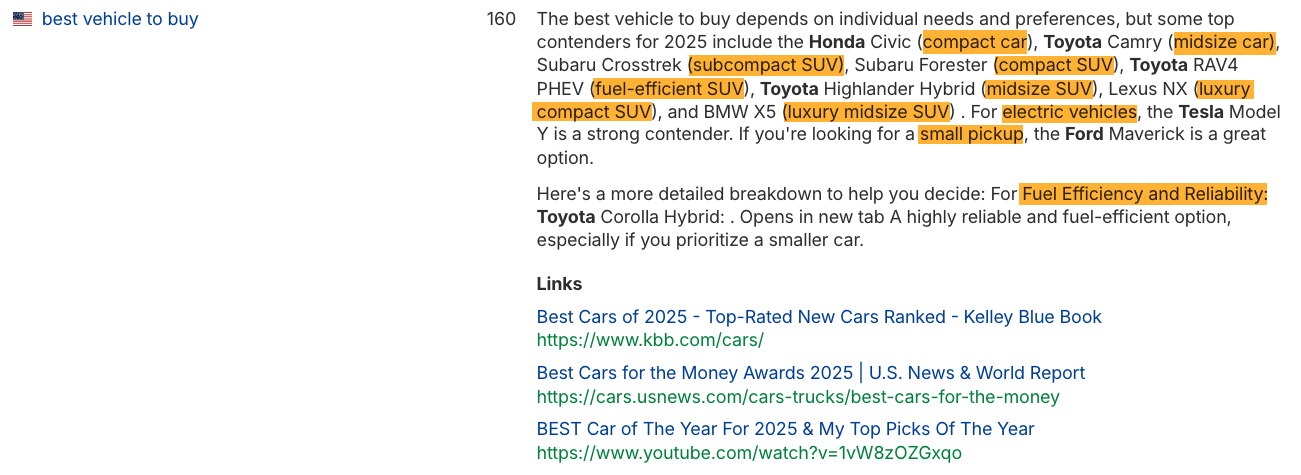
For instance, when comparing Toyota and Honda, you might notice patterns, such as Honda is often mentioned first, with attributes like affordability or compact cars being the most popular. Or that Toyota may appear second, framed around reliability and SUVs.
These differences enhance your analysis by providing a deeper understanding beyond top-level visibility. They show you (and stakeholders) each brand’s positioning and perceived authority in AI answers.
As you review these responses, pay attention to elements like:
- Volume of Mentions: Are you mentioned more or less often than your competitors across the topics your audience searches for?
- Placement Within the Response: Do you appear before or after competitors? Which brand gets the lion’s share of visibility in the response, better capturing a searcher’s attention?
- Depth of Coverage: Are you summarized in one line or described with detailed context like features, use cases, and benefits?
- Positioning and Framing: How does AI describe you (as the leader, an alternative, or just another option)?
- Sentiment: Does the language around your brand feel positive, neutral, or negative?
- Credibility: Does the response include strong credibility cues around your brand or a competitor’s (e.g., “industry-leading,” “award-winning”)?
This type of analysis gives you the qualitative layer behind the numbers, showing how AI models frame, prioritize, and describe each brand.
You can go even deeper in your analysis by comparing each brand’s topic ownership.
Take a moment to list out the topics or product categories that you would like your brand to be seen as a leader for. Once you have a list, add them to the Market or niche search box in Brand Radar:
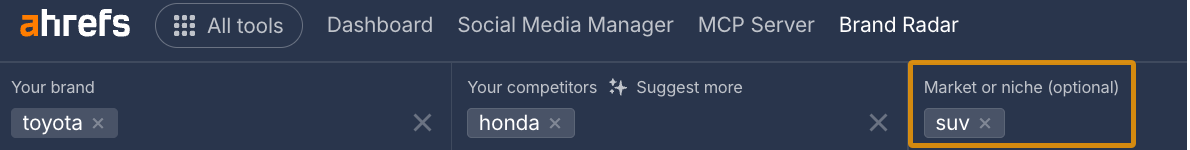
It’s easier to search these one at a time.
For each topic, check out the Overview > AI Share of voice metrics:
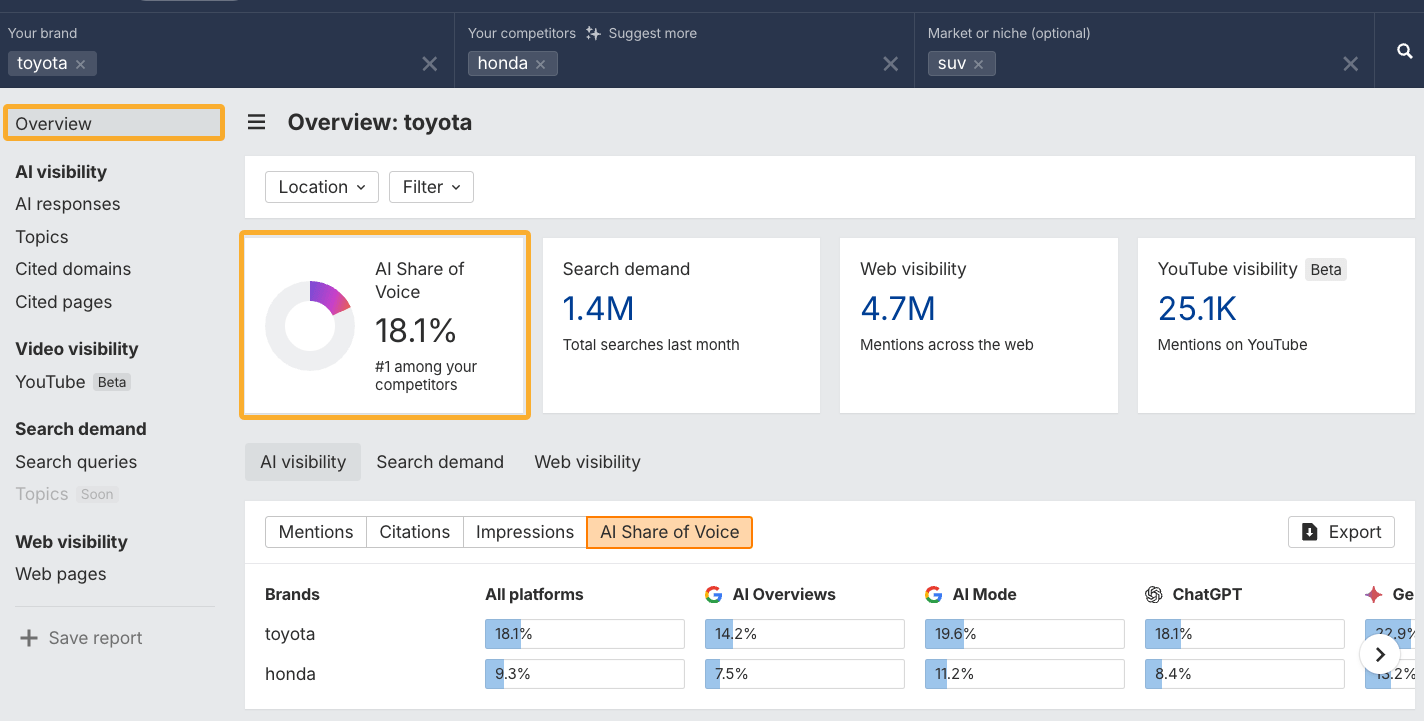
It’s worth benchmarking your AI Share of Voice for each of the topics you’d like to lead and how you compare against other brands in AI search.
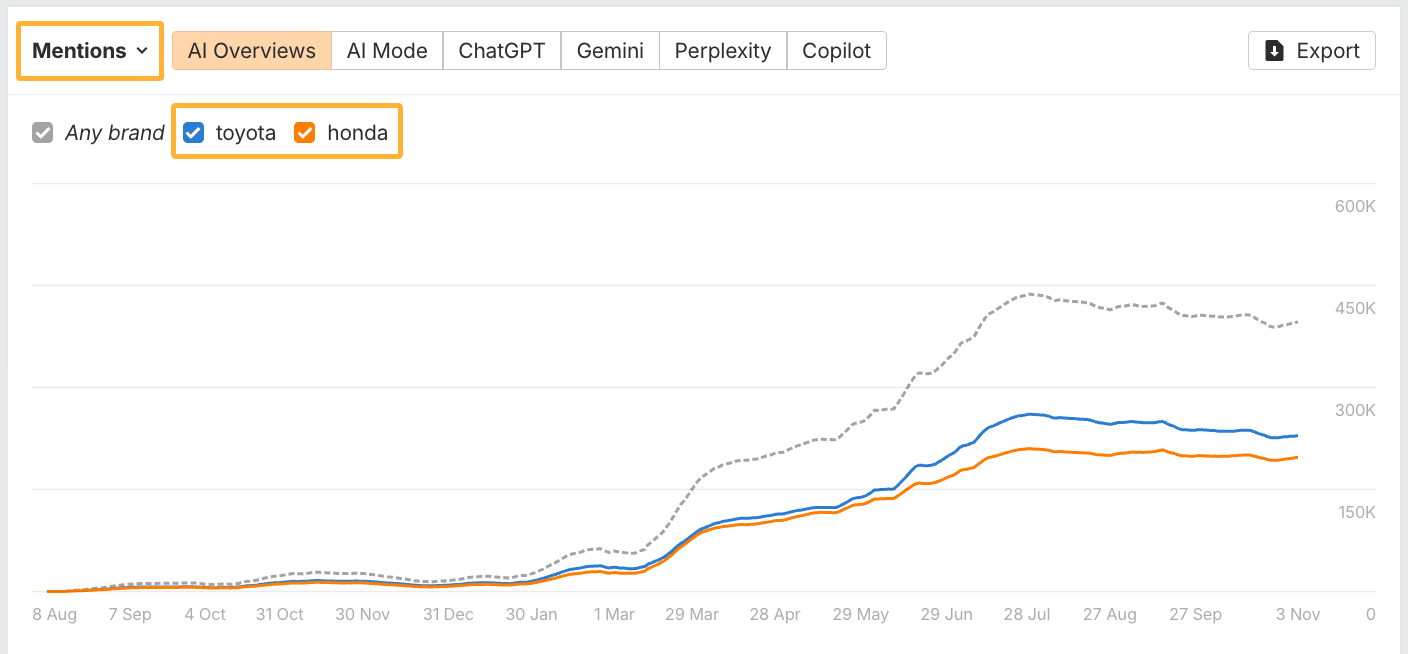
You can also track changes over time:
![]()
![]()
You can also check out the Topics report to compare each brand side by side for common themes and sub-topics:
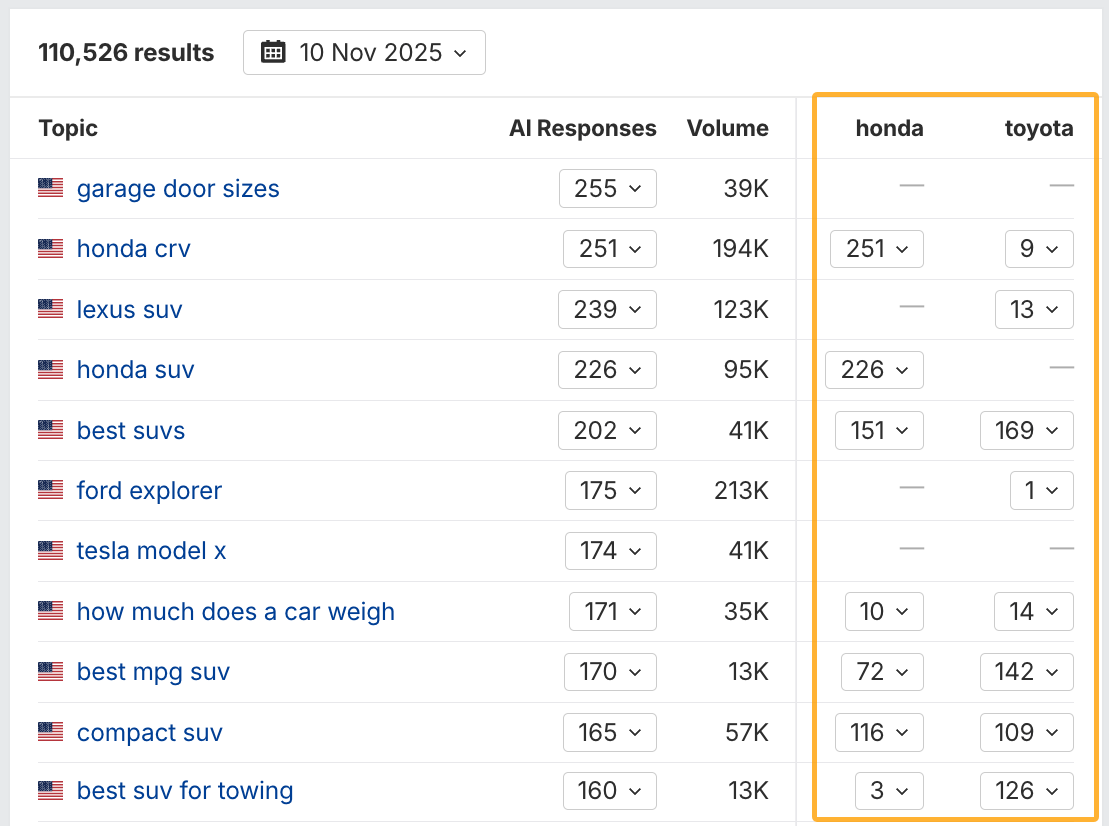
For example, you could uncover insights like:
- Irrelevant topics to exclude with filters. For example, queries about garage doors may be relevant to the topic of SUVs, but it’s unlikely any car brand will earn meaningful mentions in those responses.
- Other competitors that are connected to the topic. For example, searchers frequently connect brands like Honda, Lexus, Ford, and Tesla to SUVs. These may be additional competitors to keep an eye on.
- Unbranded topics to improve your visibility for. For example, Toyota is mentioned in more responses about “best SUVs,” while Honda is mentioned more for “compact SUVs”.
- Specific attributes connected to the topic. For example, Honda could optimize its relevant products to increase visibility for “MPG SUV” or “SUV for towing” queries.
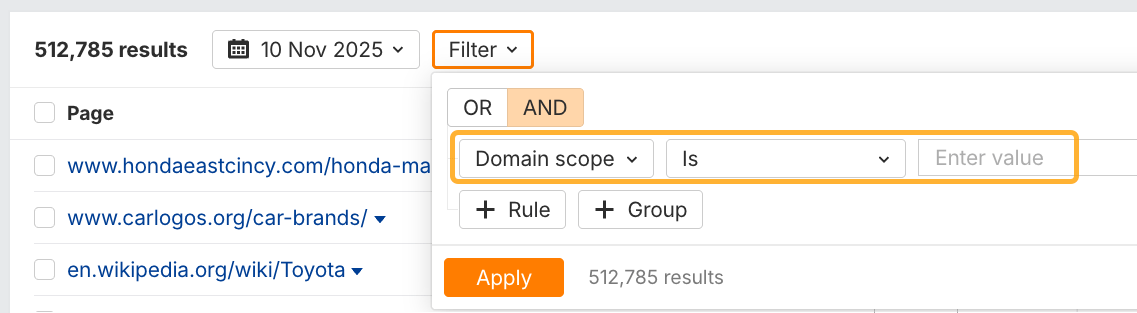
To find each brand’s top-cited pages in AI search, check out the Cited Pages report and apply the domain filter right above the list of pages:
Add your brand first. Then check each competitor one at a time so that you can more easily see each brand’s best pages.
If you’re doing a detailed analysis, add each of the competitors’ websites that you scoped out in Step 2 of this process to see citations across all of them.
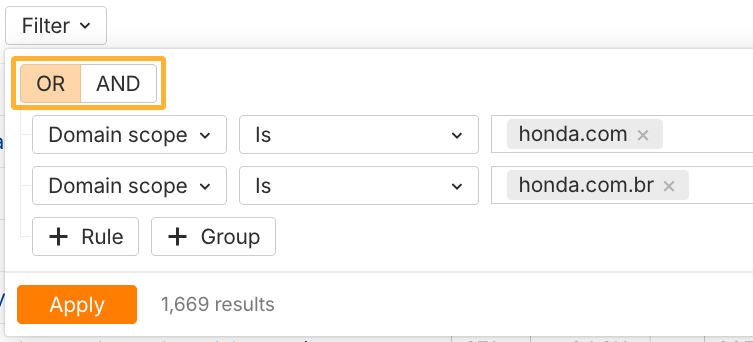
You can also try out different filter settings to focus on the most relevant pages or broaden the scope to make sure you haven’t missed anything.
For instance, I like to use the Domain scope setting, which automatically includes the entered domain and its subdomains. I also switch the and/or toggle to “OR” to broaden the results of this analysis.
Depending on how deep you want to go, you can also adjust the filters at the top. For example, say we wanted to see Honda’s top citations for unbranded queries only, we could apply this filter:
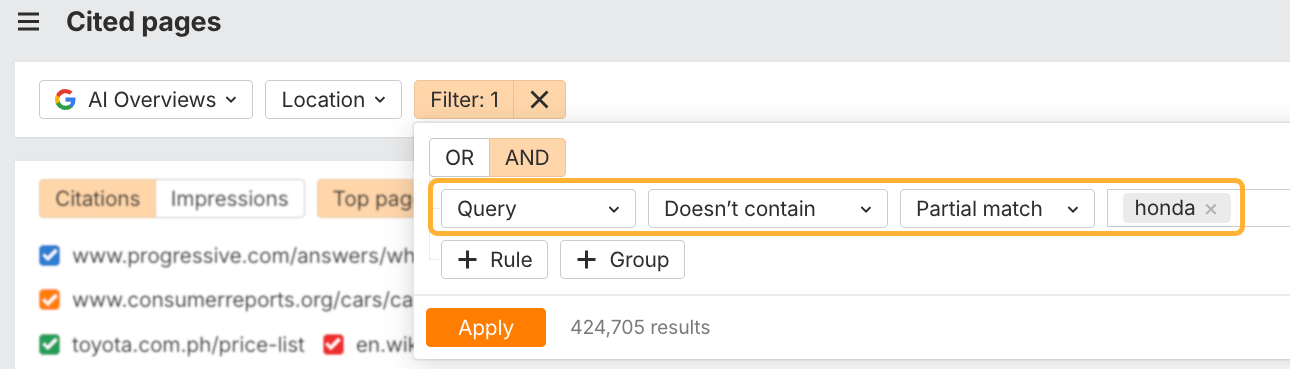
Once you’ve added all the filters you want, you’ll be left with a list of the top-cited pages in AI responses for each brand.
Gather this list for each AI search platform you care about getting visibility for (like AI Overviews, ChatGPT etc).
Then, repeat for any other competitors.
When analyzing these lists, look for content opportunities and gaps you can close on your website. For example, your content may have:
- A visibility gap: Your brand appears less often than competitors in AI citations.
- A topic gap: A competitor covers a topic, and you don’t. Create a new page to close the gap.
- A format gap: AI often cites a particular type of content format (e.g., guides, videos, reviews) that you’re missing.
- A freshness gap: A competitor wrote about the topic more recently and gets more visibility as a result.
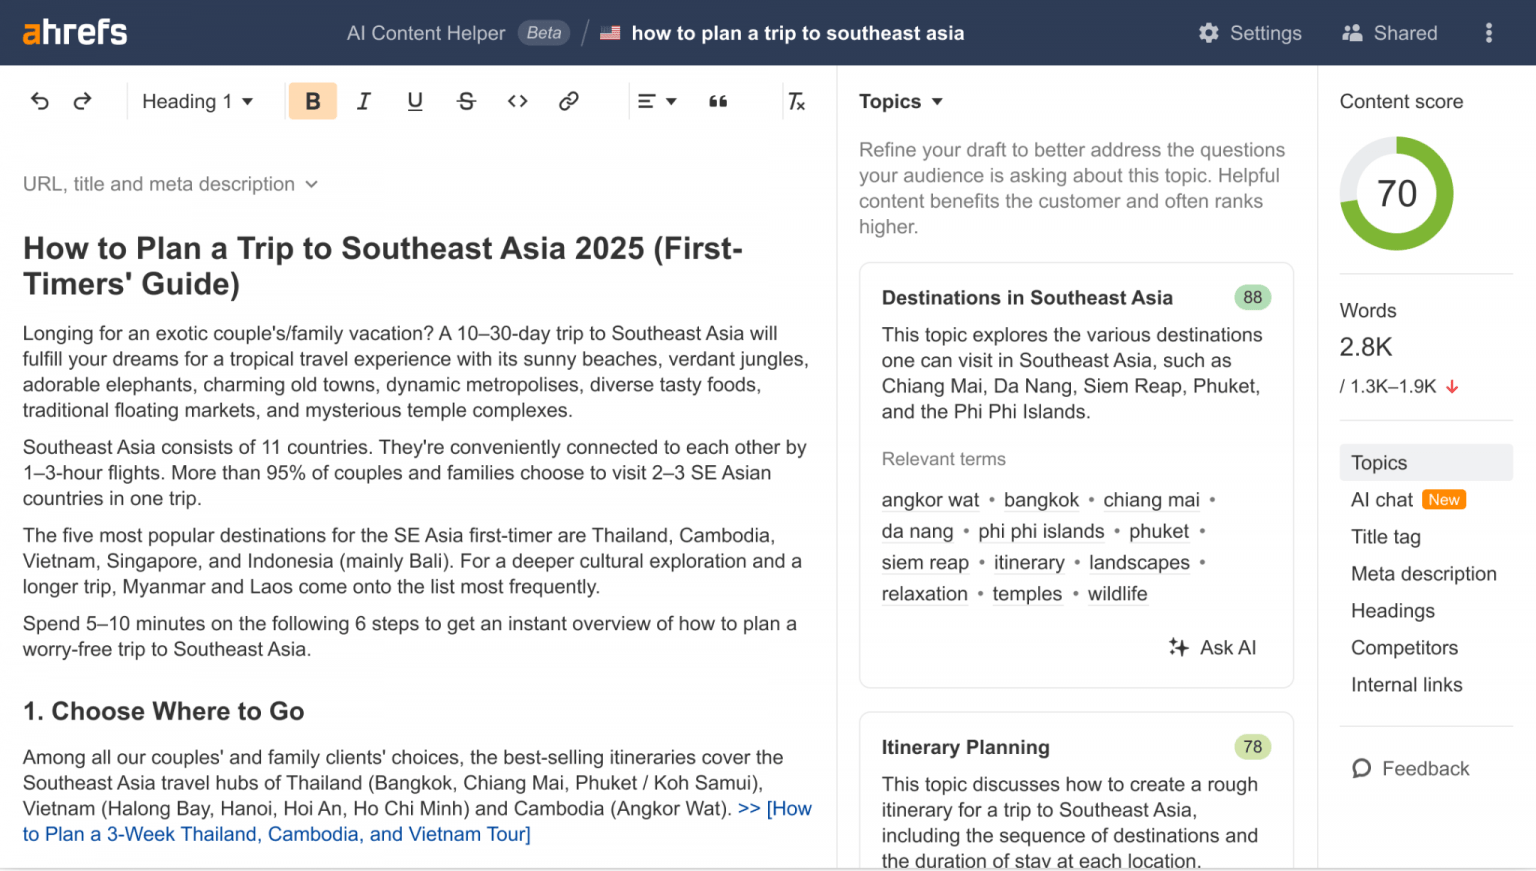
To close these gaps, you’ll likely need to create new content or update existing content. Ahrefs’ AI Content Helper can help with this. It analyzes your content as you type, allowing you to cover essential gaps.
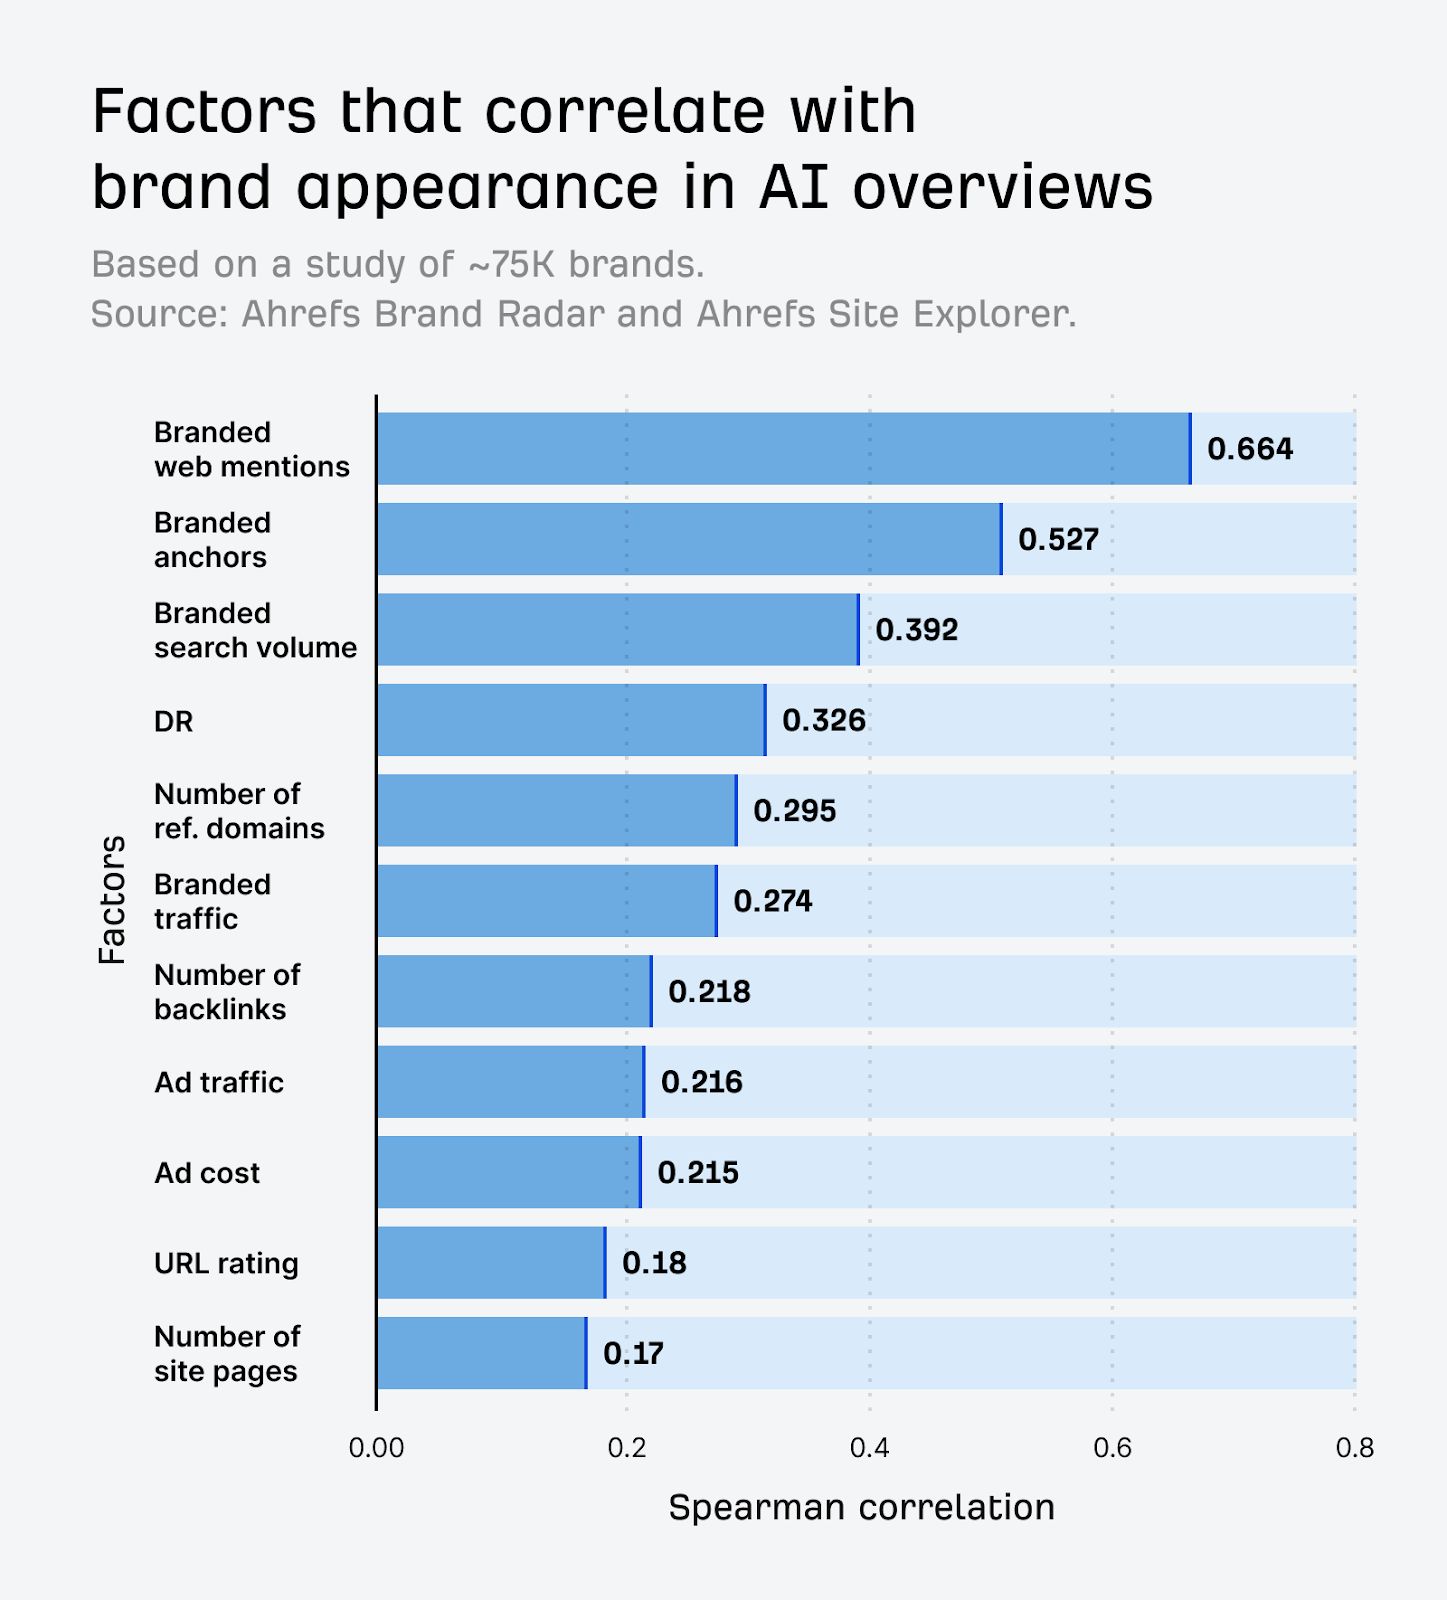
The final check worth doing is to analyze how your competitors are mentioned around the web. Brand mentions in third-party content are a strong factor that influences visibility in AI responses.
More often than not, AI will cite someone else’s content (even for queries about your brand) than yours.
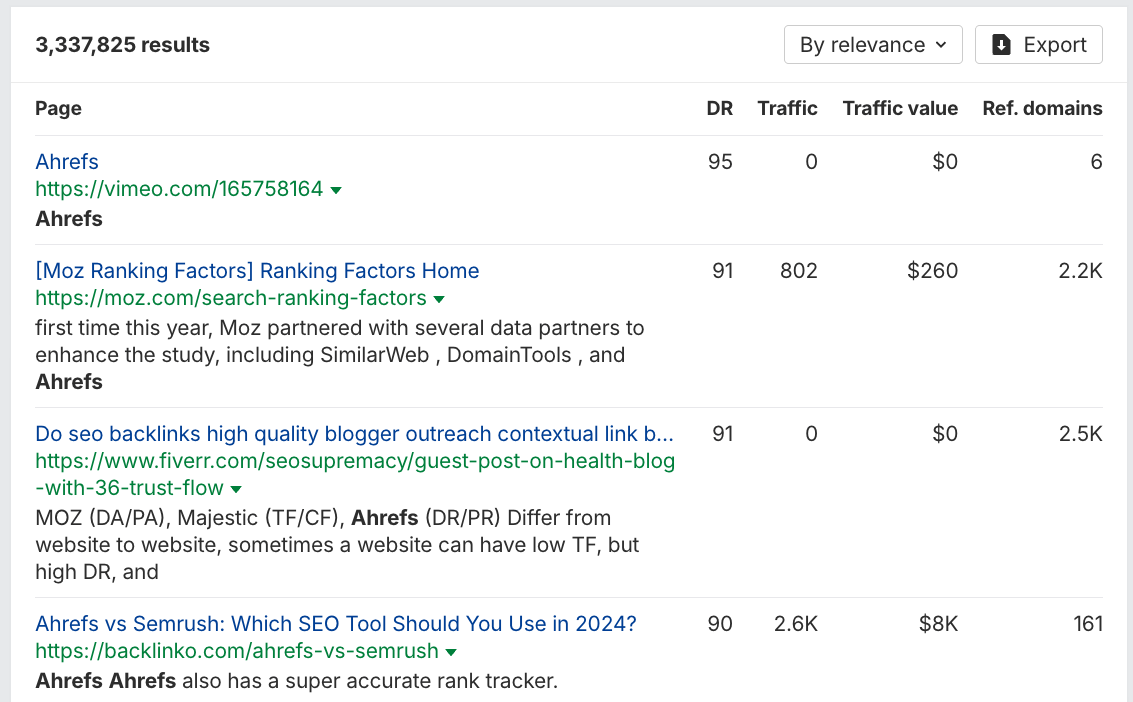
So, it’s worth checking which sources influence information about your brand and competitors. In Brand Radar, you can check out the Web pages report to find all mentions of any brand online.
To find gaps in web mentions, I like to search each competitor individually in the main search bar.
Then I use the filters in the Web pages report to remove mentions on their own websites and then export the results.
For instance, you can use “-site:yourcompetitor.com” to remove a competitor’s brand mentions on their own website.
Once you’ve removed irrelevant results, export the list so you can compare it against your brand and other competitors in a spreadsheet. Try out this simple template. Add your exported data to columns B–H, ensuring they are aligned correctly. Then manually fill in the brand in column A.
Keep adding each brand’s export to the bottom of the list.
Once you’ve added data for a few brands, here’s what the comparison view will look like:
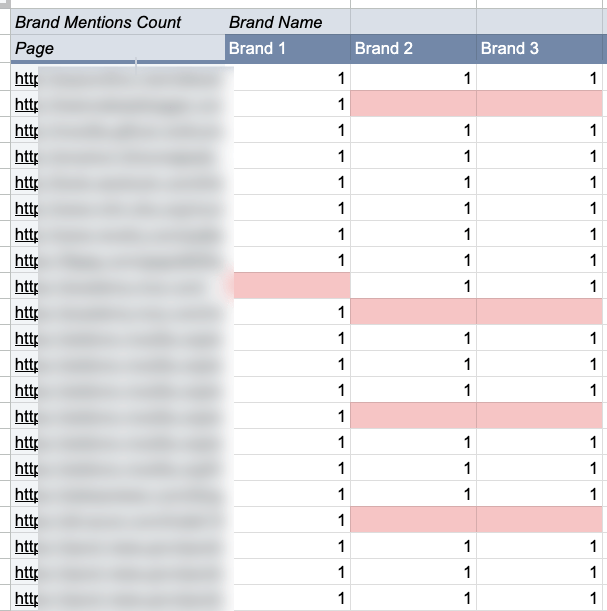
The empty cells point to missed opportunities. Start by scanning for posts or responses that highlight several competitors but leave your brand out; these are likely your fastest wins.
Next, analyze how your competitors earned their most impactful mentions:
- Content types: Are their mentions embedded in blog posts, research reports, or case studies? These formats might be worth replicating or targeting in your outreach efforts.
- Publications and sources: Are the same authors or websites referencing them consistently? If so, they may be trusted voices in your space and suitable candidates for outreach or collaboration.
- Campaign triggers: Was the mention associated with a product release, viral post, or a unique framework? Identify what sparked the attention to guide your own strategic moves.
- Distribution tactics: Guest articles, joint content, or partner campaigns might be amplifying their presence.
Reverse engineering what’s working for your competitors helps you close visibility gaps, understand which tactics actually move the needle in your category, and how to make them work for your brand.
By this point, your competitor analysis will reveal how each brand performs across AI search; who dominates visibility, who’s catching up, and where you have room to move. The final step is packaging these findings into a story your team can act on.
Start by translating your observations into clear, actionable priorities:
- Fix: Close visibility or perception gaps compared to competitors. These cost you brand authority in AI responses, often due to inaccurate descriptions, missing brand data, or underperforming topics.
- Build: Strengthen content and topical coverage where competitors lead. Create or update pages that align with the formats and attributes AI rewards most.
- Influence: Strengthen relationships with publications, creators, and data sources that frequently feed AI answers in your category and mention competitors more than you.
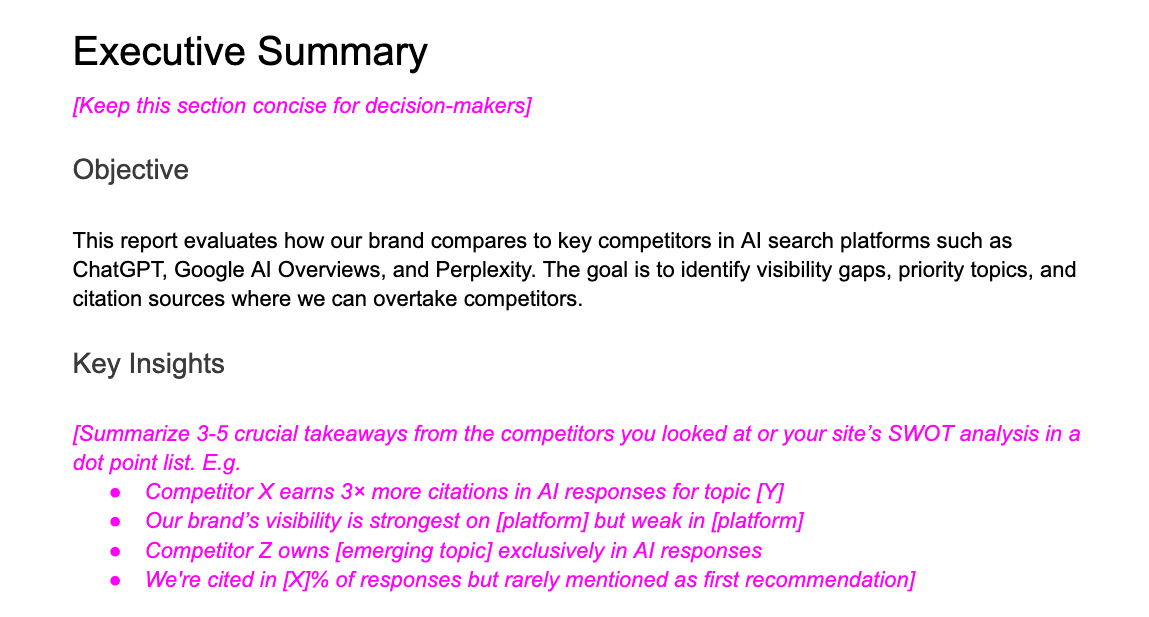
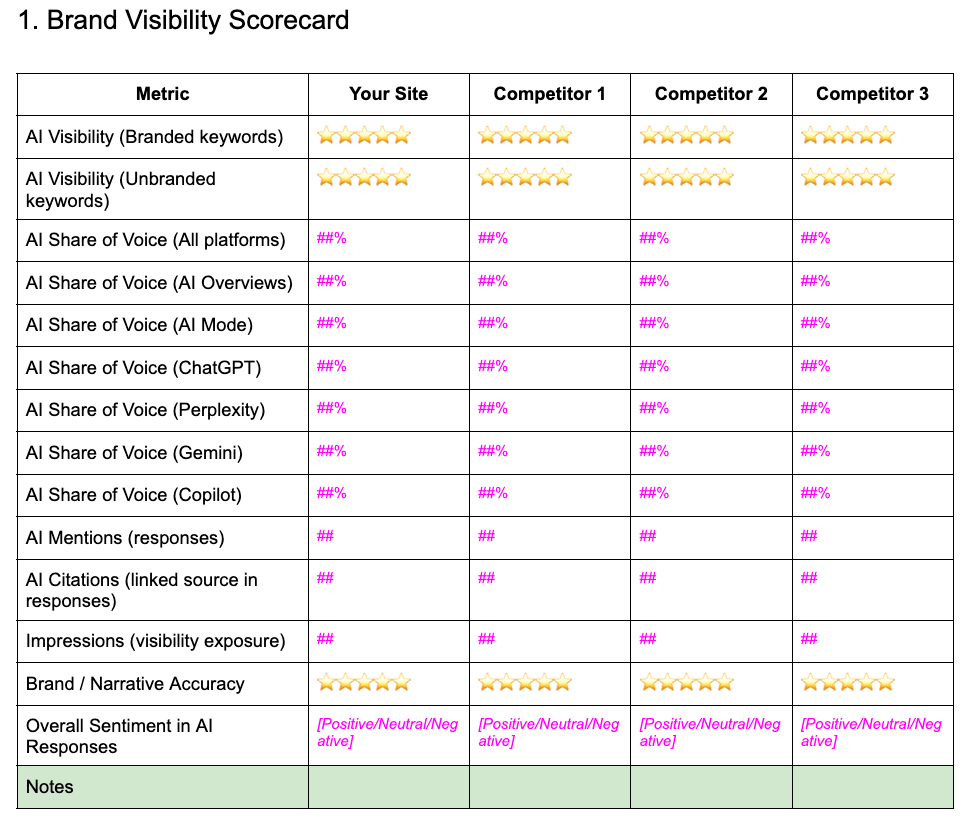
Then, summarize your findings in a stakeholder-ready report. Download our AI Search Competitor Analysis Report template if you don’t already have one.
Replace all the pink sections and summarize your key findings in scorecards and quick snapshots of key points.
Also, it’s worth making competitor tracking a recurring workflow.
Run the same analysis monthly or quarterly to measure how share of voice and brand framing evolve across AI models and markets.
AI search changes fast, and regular benchmarking turns your one-off study into an ongoing strategic advantage.
Final thoughts
An AI search competitor analysis goes beyond measuring who’s winning visibility by explaining why they’re winning.
By combining quantitative data (mentions, citations, impressions, share of voice) with qualitative context (framing, sentiment, credibility), you can pinpoint the levers that influence AI perception for your brand compared with competitors.
Over time, these insights help you refine positioning, content strategy, and digital PR, not just for Google, but for every AI system interpreting your brand.